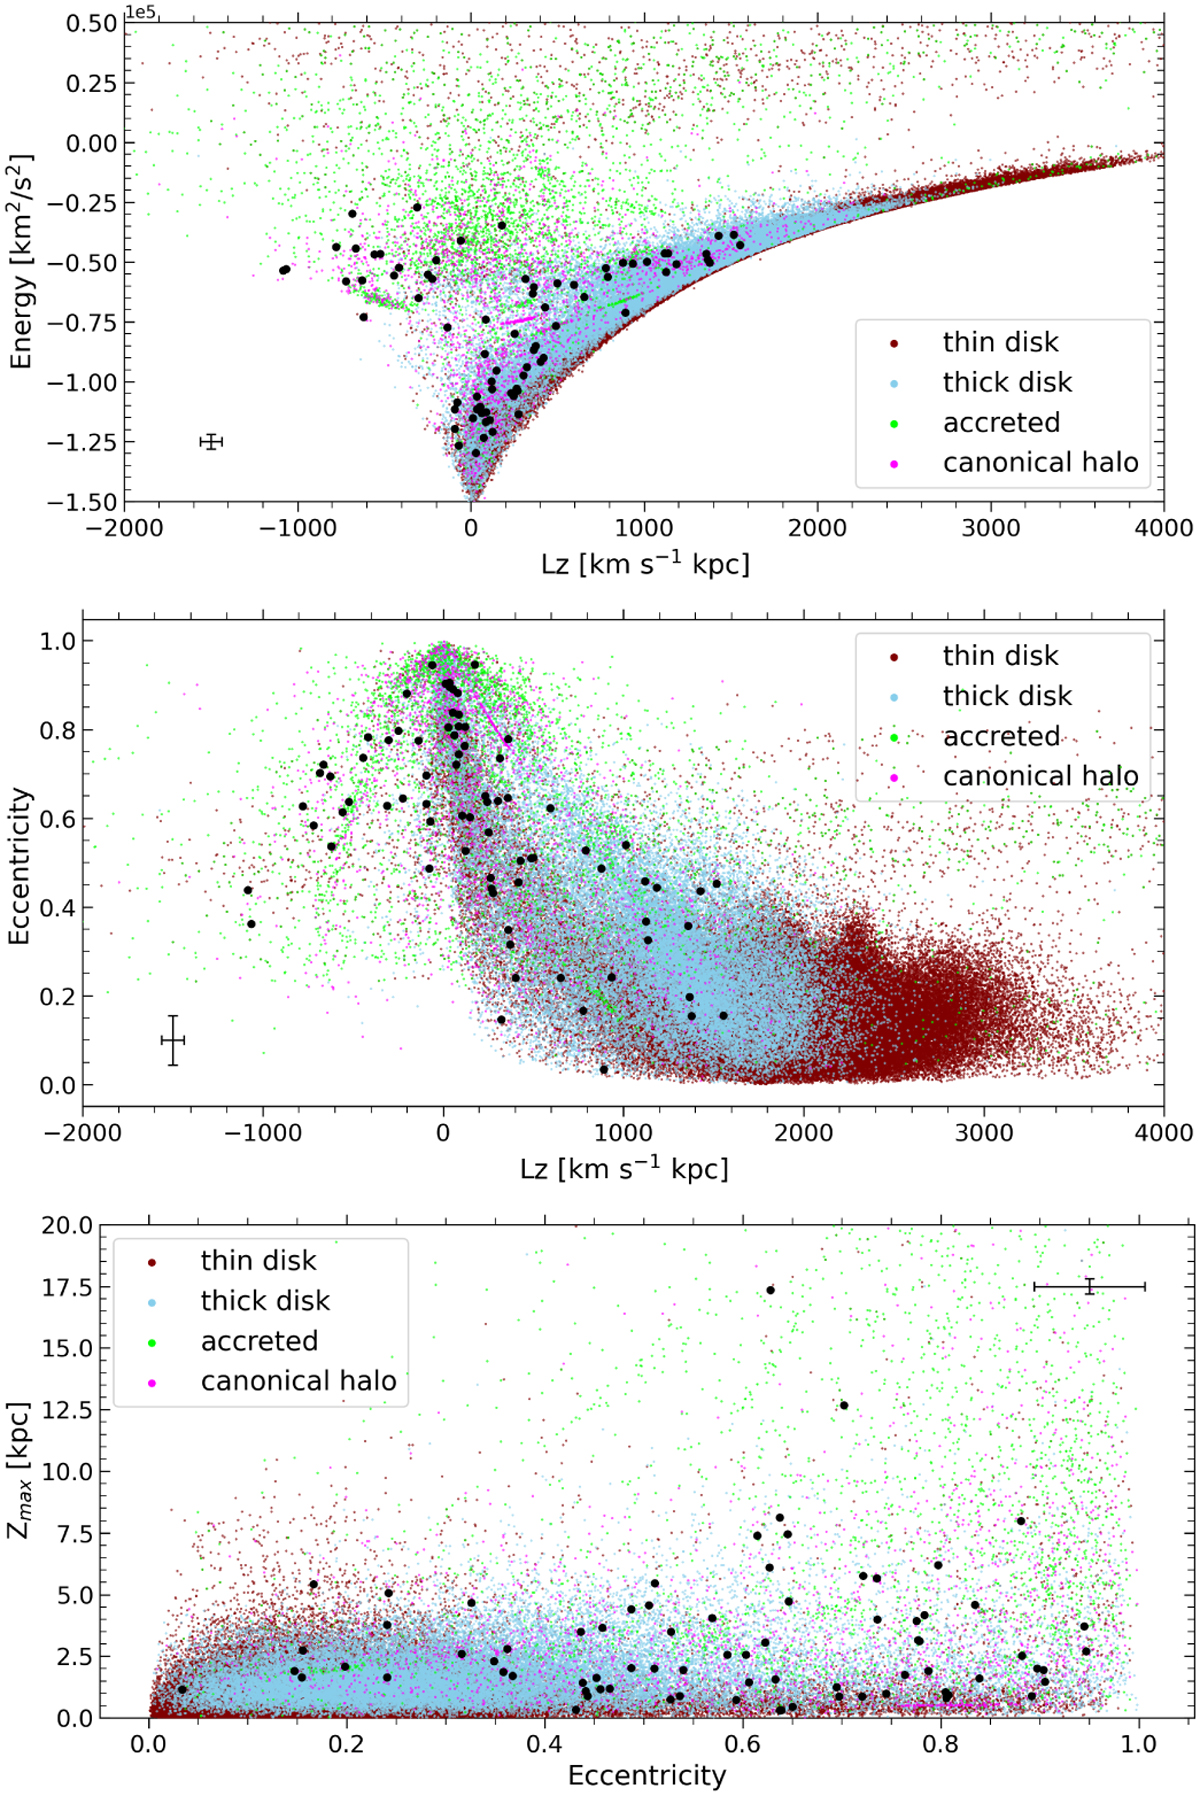
Fig. 11
Download original image
P-rich stars (black dots) plotted against a background sample in three different dynamical planes: total energy vs. angular momentum Lz (top panel), eccentricity vs. Lz (middle panel), and maximum height above the midplane Zmax vs. eccentricity (bottom panel). To separate the background sample into thin-disk, thick-disk, canonical halo, and accreted halo stars, we used the results from Hawkins et al. (2015), Masseron & Gilmore (2015), and Hayes et al. (2018) (see main text for more details). For clarity, we give a typical error bar for the P-rich stars corresponding to the average error of their parameters.
Current usage metrics show cumulative count of Article Views (full-text article views including HTML views, PDF and ePub downloads, according to the available data) and Abstracts Views on Vision4Press platform.
Data correspond to usage on the plateform after 2015. The current usage metrics is available 48-96 hours after online publication and is updated daily on week days.
Initial download of the metrics may take a while.