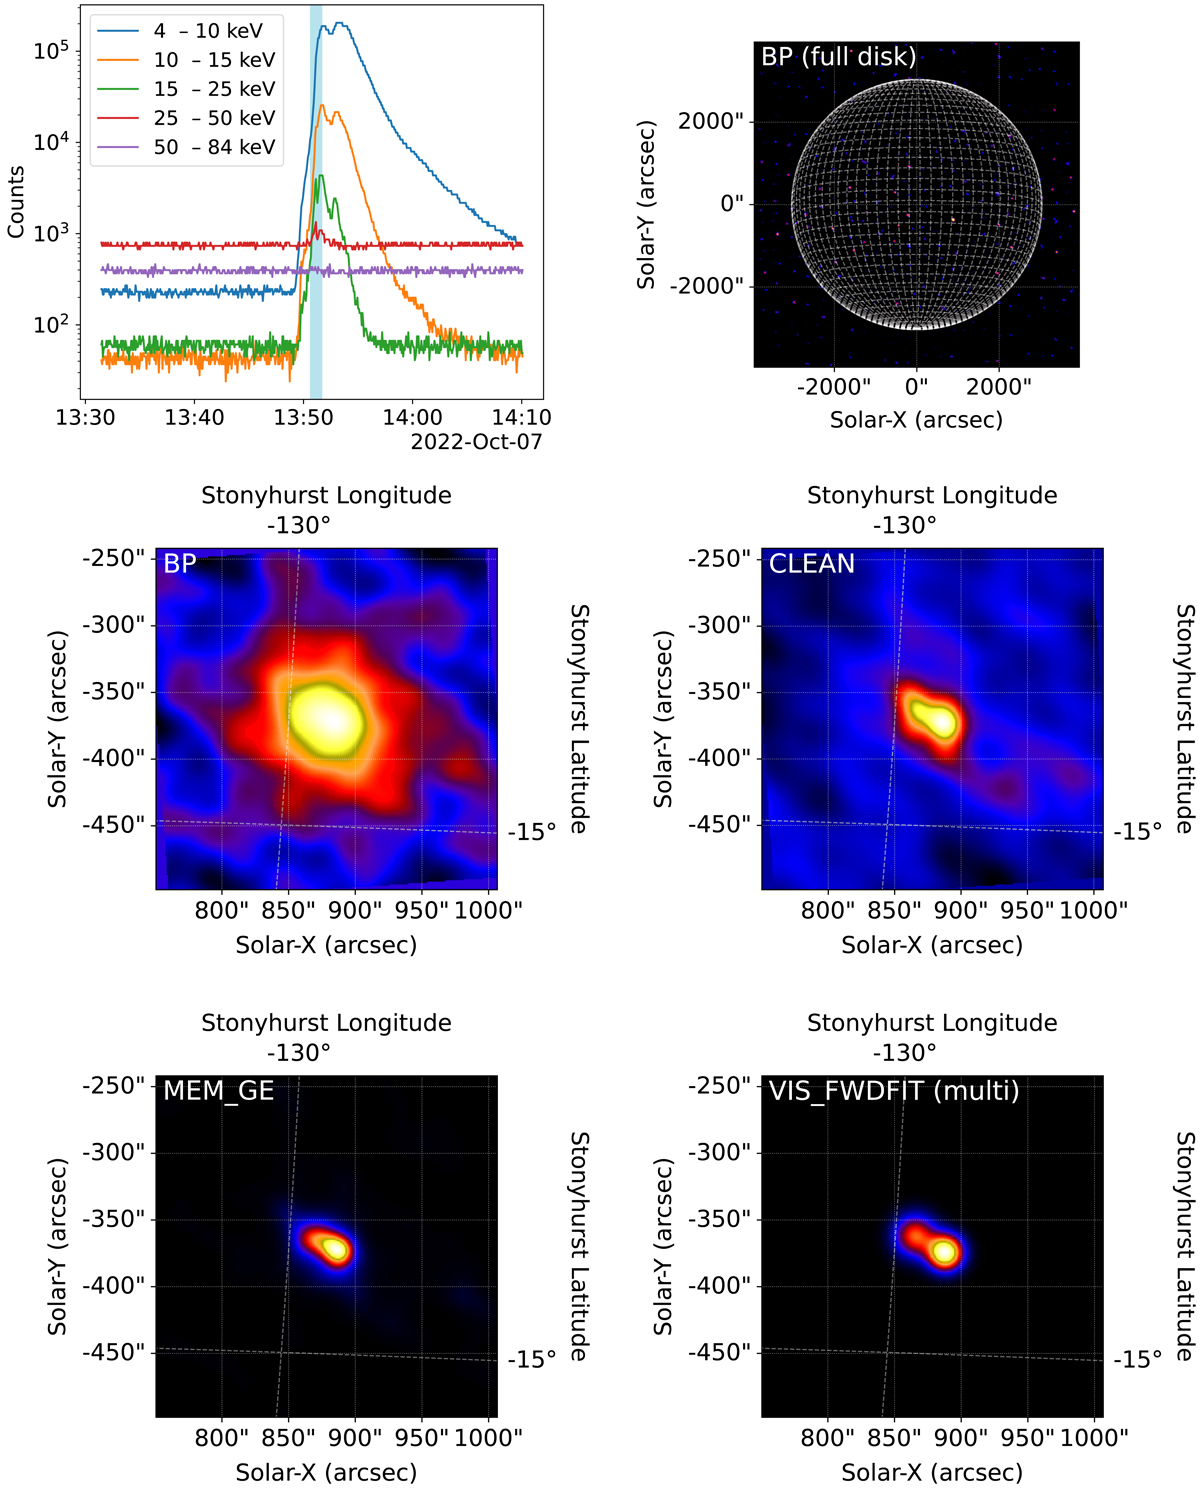
Fig. 7.

Download original image
STIX QL light curves and reconstructed images of the solar flare observed at 2022-10-07T13:50:39 (UTC), created by the image reconstruction pipeline. A 1-min integration time around the peak was selected and the images were reconstructed using four different algorithms: Back-Projection (BP), CLEAN, MEM_GE, and VIS_FWDFIT. The full-disk BP image shown in the top row of the right panel has been used to identify the source location. The other reconstructions were performed around the location of the flare. We note that the multiple circular Gaussian shapes have been selected for reconstructing the flaring source by means of VIS_FWDFIT (bottom-right panel).
Current usage metrics show cumulative count of Article Views (full-text article views including HTML views, PDF and ePub downloads, according to the available data) and Abstracts Views on Vision4Press platform.
Data correspond to usage on the plateform after 2015. The current usage metrics is available 48-96 hours after online publication and is updated daily on week days.
Initial download of the metrics may take a while.


