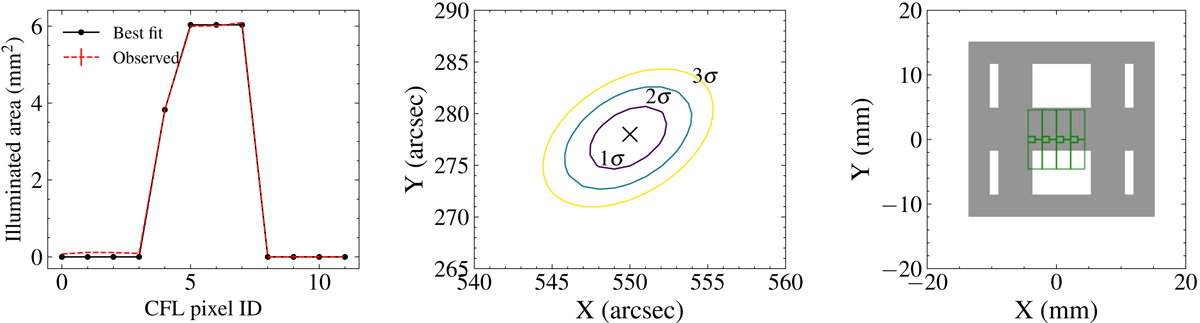
Fig. 6.
Download original image
Example of a coarse flare location solution. Left: calculated areas of illuminated regions of the 12 CFL pixels and the best-fit simulated pattern for the flare location at (550, 278) arcsec. Pixels 0–3 are the top big pixels, pixels 4–7 are the bottom pixels, and pixels 8–11 are the small pixels as shown in the right panel. Middle: best-fit flare centroid location (marked by x) and its 1σ, 2σ, and 3σ confidence contours. Right: projection of CFL subcollimator (the gray shaded regions) on the detector pixels (the green closed areas) simulated for the best-fit flare location. The top row, bottom row, and small pixels (from left to right) are numbered sequentially from 0 to 11.
Current usage metrics show cumulative count of Article Views (full-text article views including HTML views, PDF and ePub downloads, according to the available data) and Abstracts Views on Vision4Press platform.
Data correspond to usage on the plateform after 2015. The current usage metrics is available 48-96 hours after online publication and is updated daily on week days.
Initial download of the metrics may take a while.