Fig. 5.
Download original image
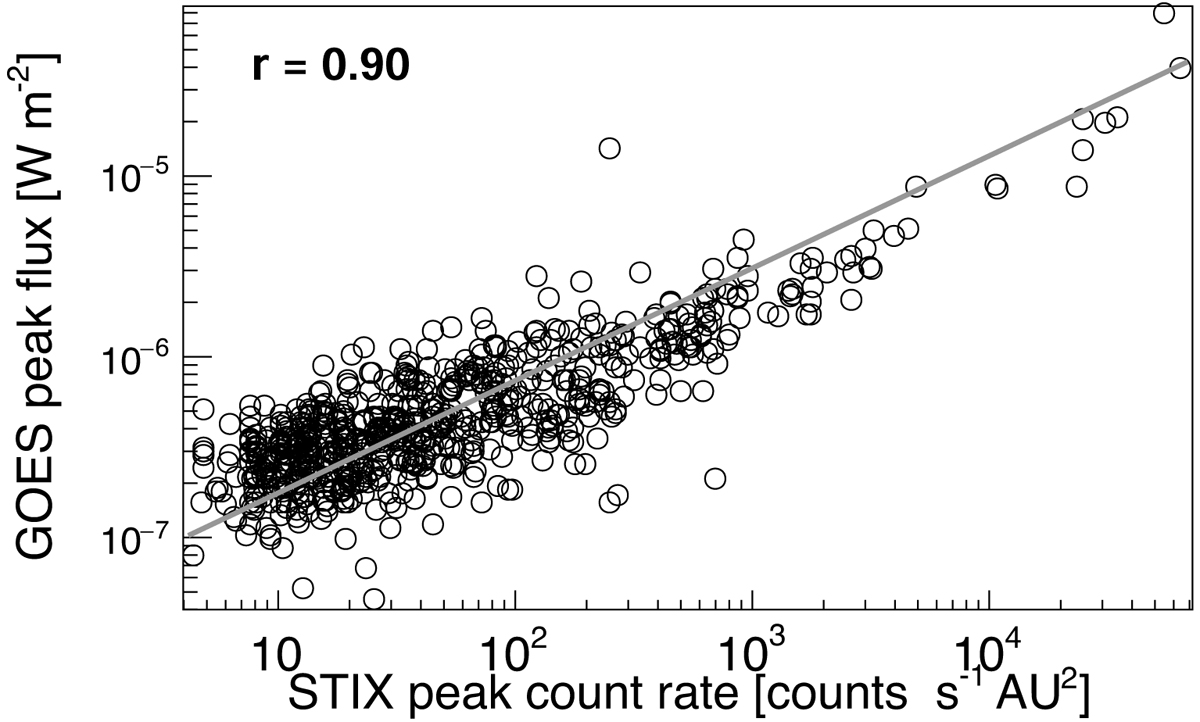
Scatter plot of GOES/XRS low channel peak flux with respect to STIX 4–10 keV count rates scaled to 1 AU for 717 solar flares observed by both GOES and STIX during the cruise phase. The solid line is a linear fit to the log–log graph. The Pearson’s correlation coefficient in the log–log scale is 0.91. From the fit, we get the following GOES flux estimation formula: f = 10−7.376 + 0.622log10(X′) (in units of W m−2), where X′ is the STIX peak count rate corrected for the distance variations between the Sun and Solar Orbiter.
Current usage metrics show cumulative count of Article Views (full-text article views including HTML views, PDF and ePub downloads, according to the available data) and Abstracts Views on Vision4Press platform.
Data correspond to usage on the plateform after 2015. The current usage metrics is available 48-96 hours after online publication and is updated daily on week days.
Initial download of the metrics may take a while.