Fig. 4.
Download original image
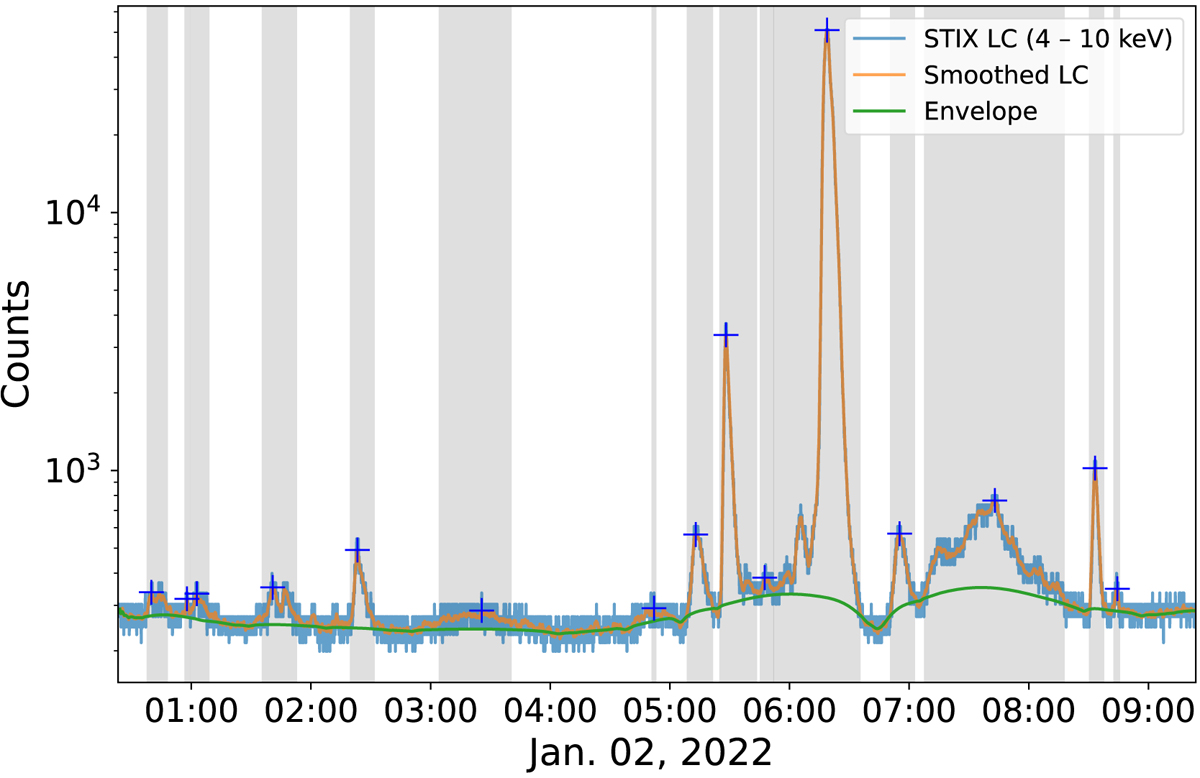
STIX 4–10 keV QL light curve for 2022-01-02T00:30:00 – 2022-01-02T09:30:00 (UTC) and identified flares. The orange curve is the smoothed light curve using a moving average filter with a time window of 1 min. The green curve is the estimated signal envelope using the SNIP algorithm. The identified peaks are marked with plus signs, and the gray ranges show their time ranges.
Current usage metrics show cumulative count of Article Views (full-text article views including HTML views, PDF and ePub downloads, according to the available data) and Abstracts Views on Vision4Press platform.
Data correspond to usage on the plateform after 2015. The current usage metrics is available 48-96 hours after online publication and is updated daily on week days.
Initial download of the metrics may take a while.