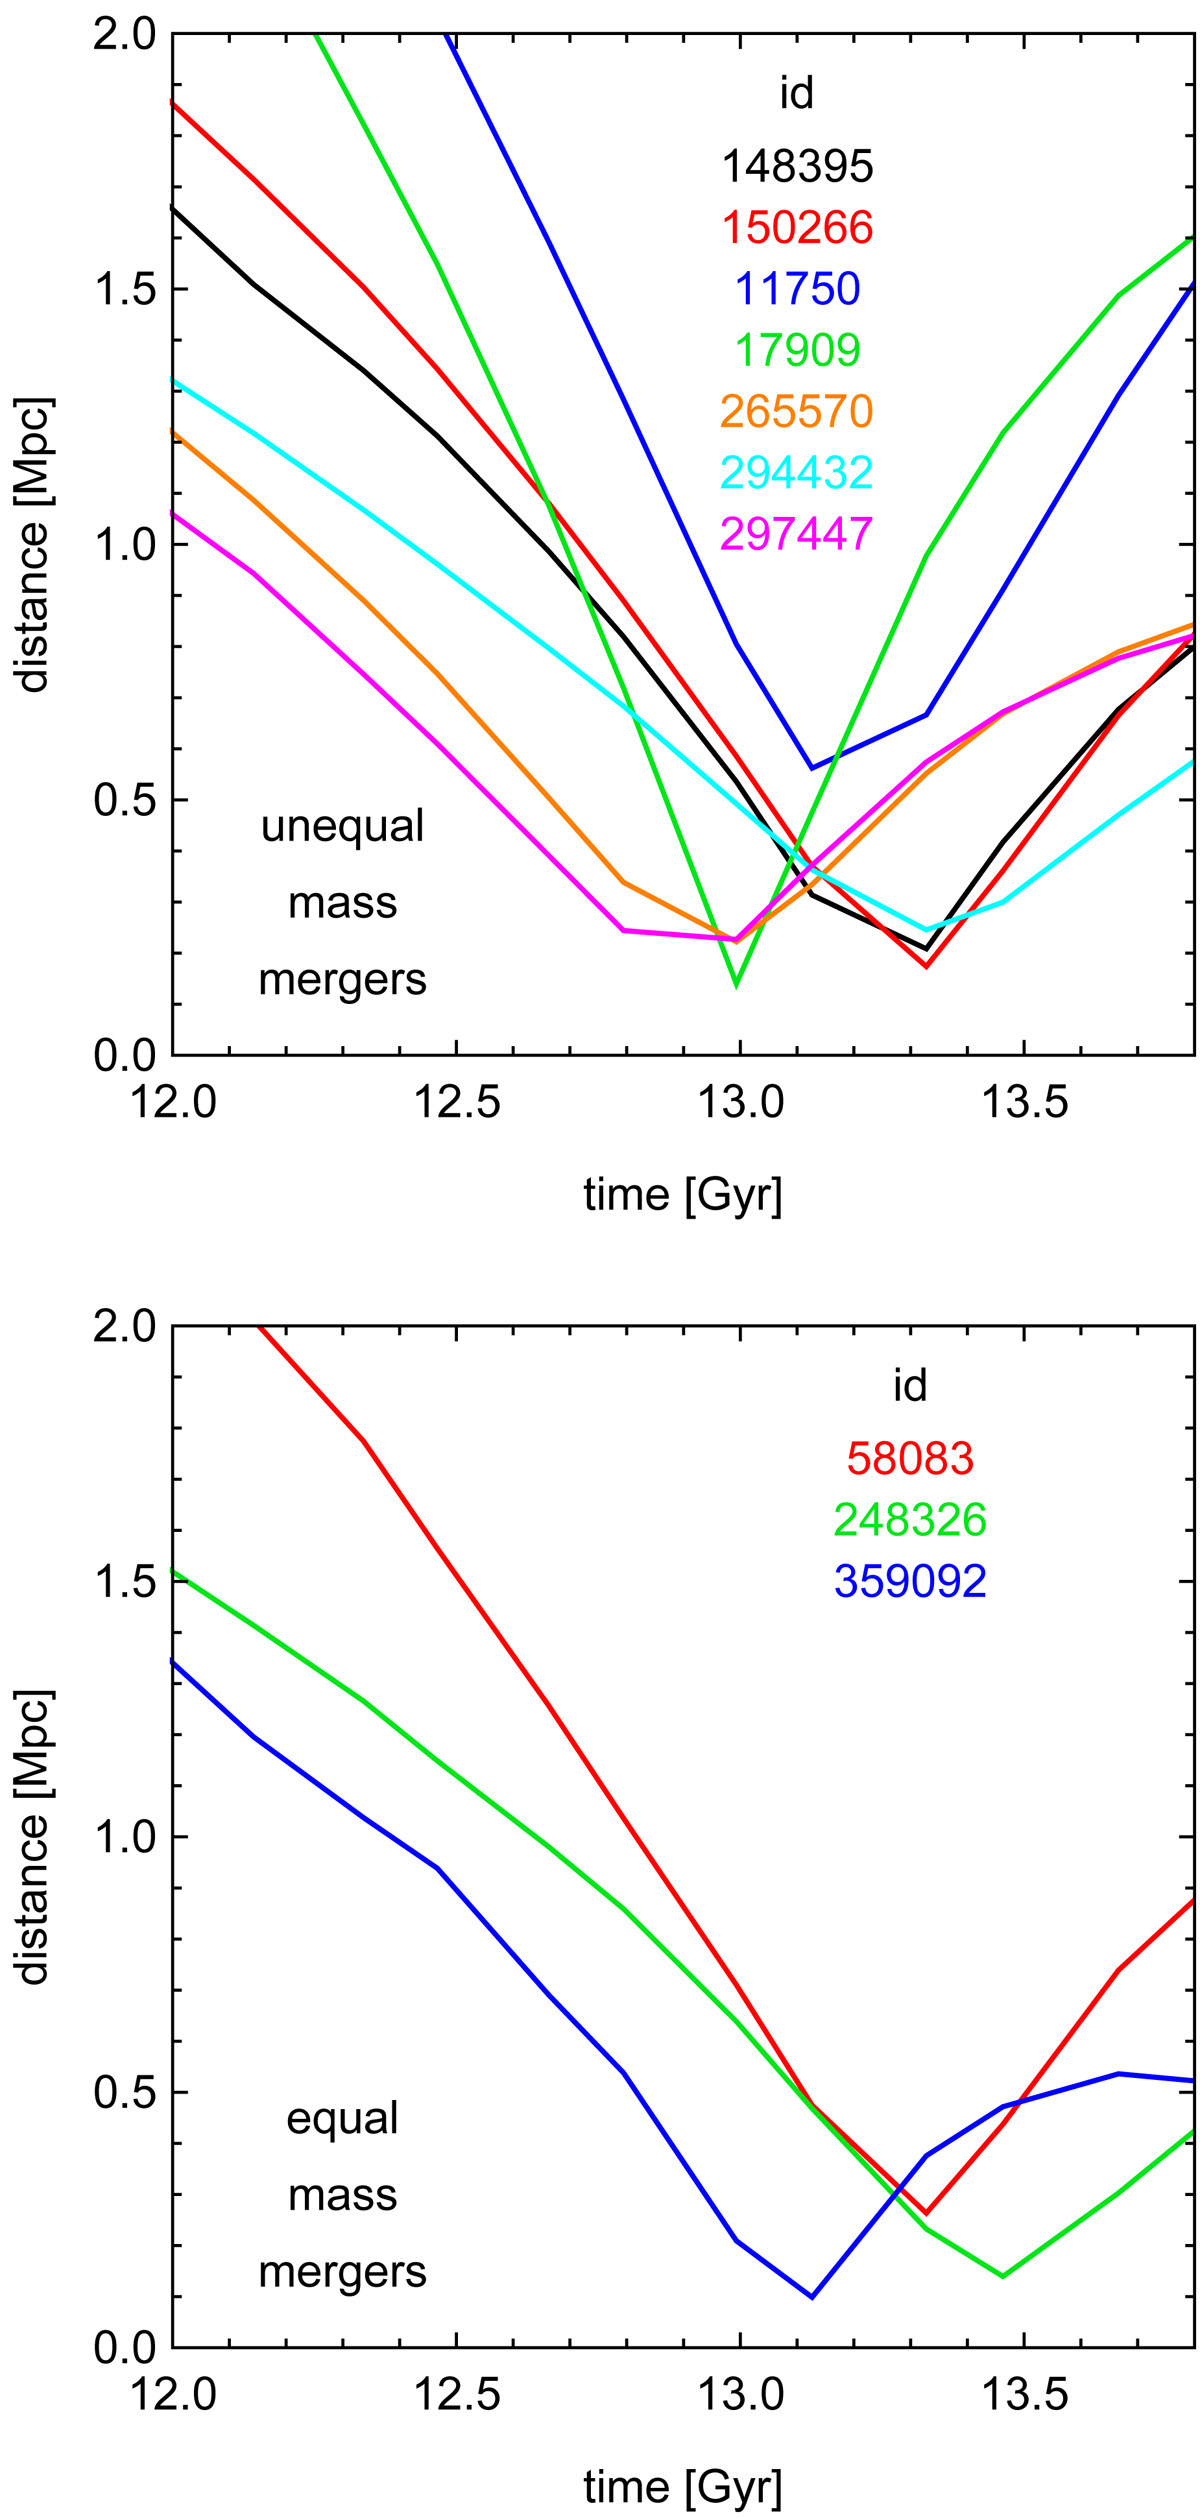
Fig. 7.
Download original image
Distance of the subcluster to the main cluster as a function of time during the last 1.8 Gyr of evolution. Colors correspond to different subclusters with id numbers (at z = 0) given in the legend. The upper panel shows the measurements for unequal-mass mergers with single bow shocks. The lower panel shows the measurements for equal-mass mergers with two similar bow shocks.
Current usage metrics show cumulative count of Article Views (full-text article views including HTML views, PDF and ePub downloads, according to the available data) and Abstracts Views on Vision4Press platform.
Data correspond to usage on the plateform after 2015. The current usage metrics is available 48-96 hours after online publication and is updated daily on week days.
Initial download of the metrics may take a while.