Open Access
Fig. 3.
Download original image
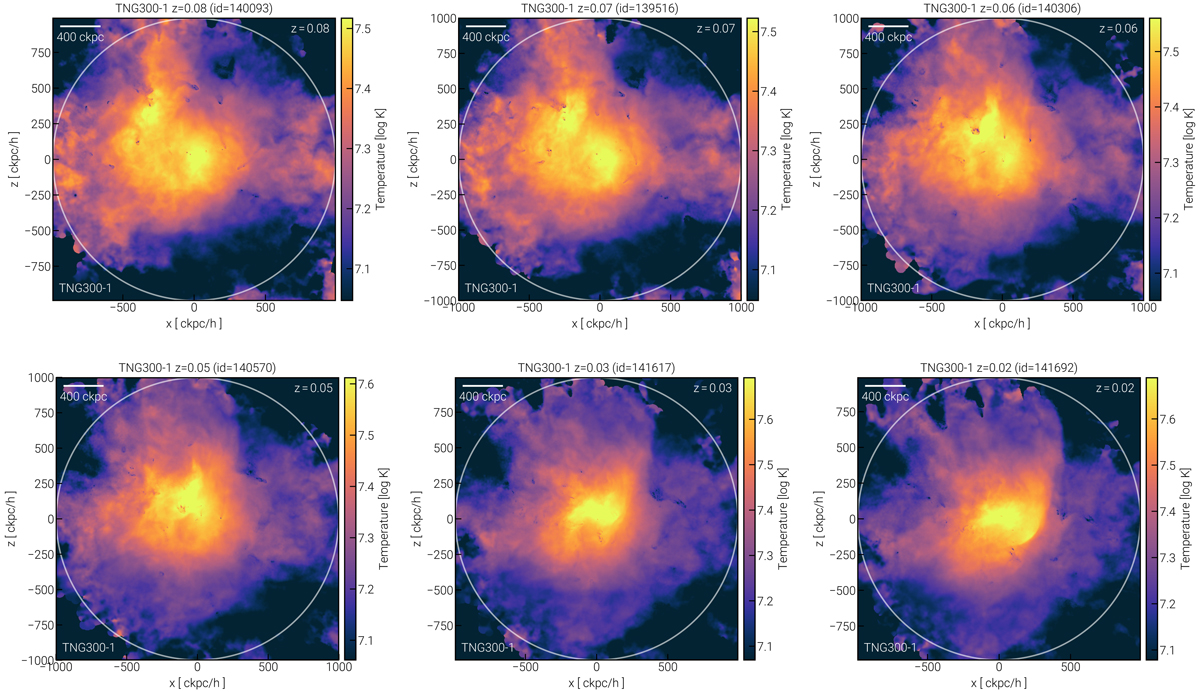
Temperature maps of the interacting clusters 148391–148395 at earlier stages of the merger. The smaller cluster moves from the upper left to the lower right in subsequent images corresponding to the times between z = 0.08 and z = 0.02.
Current usage metrics show cumulative count of Article Views (full-text article views including HTML views, PDF and ePub downloads, according to the available data) and Abstracts Views on Vision4Press platform.
Data correspond to usage on the plateform after 2015. The current usage metrics is available 48-96 hours after online publication and is updated daily on week days.
Initial download of the metrics may take a while.