Fig. 6.
Download original image
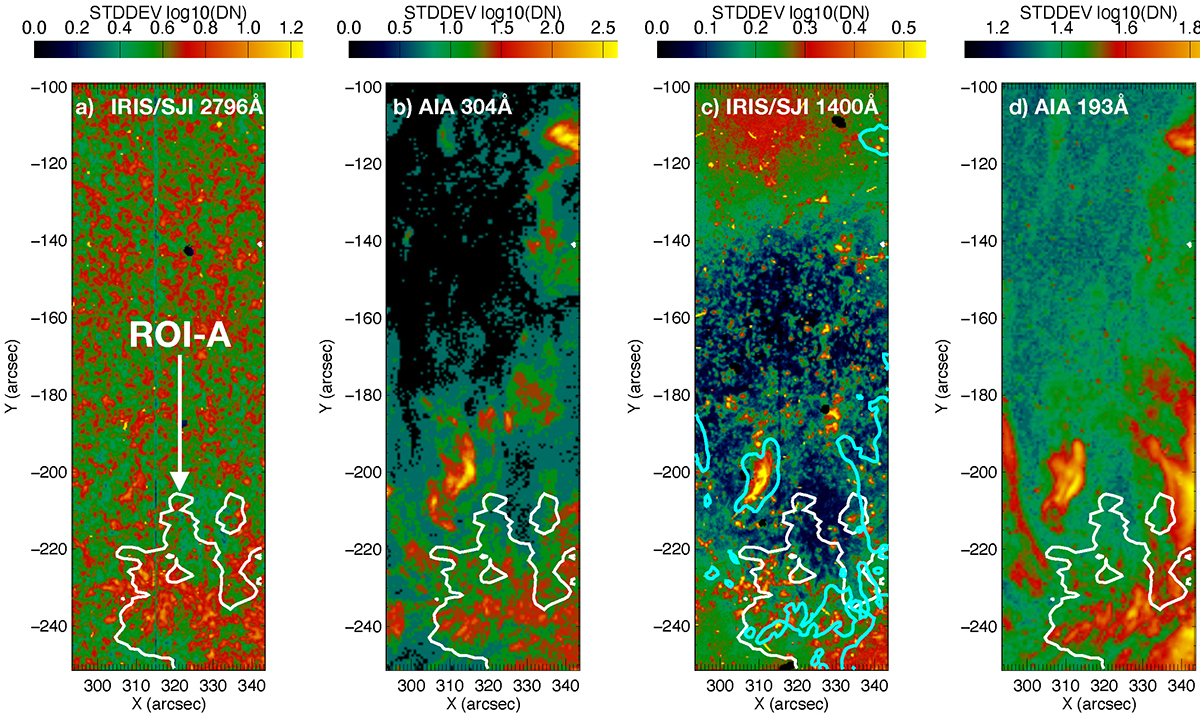
Standard deviation map of the chromosphere (a, b), transition region (c), and the corona (d). The maps are computed for the time range between 00:32 to 00:52 UT on 30 March 2022. The white contour presents the ROI-A that spatially corresponds to the coronal upflow region with a velocity v < −5 km s−1. The blue contour in panel c shows a strong standard deviation of AIA 193Å intensity of 20 DN/s (panel d).
Current usage metrics show cumulative count of Article Views (full-text article views including HTML views, PDF and ePub downloads, according to the available data) and Abstracts Views on Vision4Press platform.
Data correspond to usage on the plateform after 2015. The current usage metrics is available 48-96 hours after online publication and is updated daily on week days.
Initial download of the metrics may take a while.