Fig. 5.
Download original image
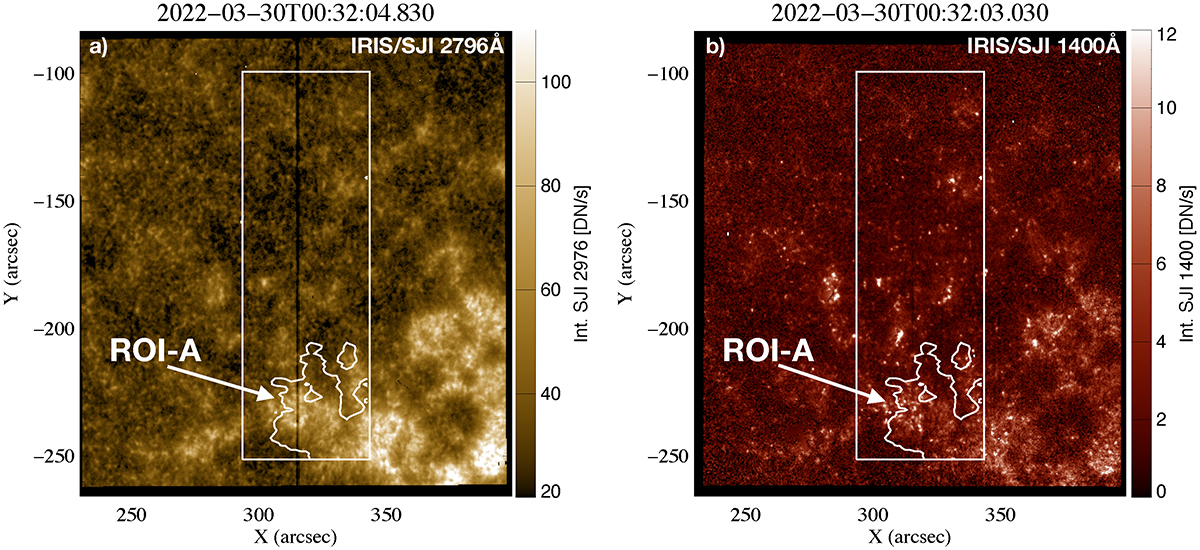
Highly dynamical small-scale structures are observed in the transition region with IRIS SJI 2796 (panel a) and IRIS SJI 1400 (panel b). The rectangle shows the Hinode/EIS field of view. The contour inside it presents ROI-A that spatially corresponds to the coronal upflow region with a projected velocity v < −5 km s−1.
Current usage metrics show cumulative count of Article Views (full-text article views including HTML views, PDF and ePub downloads, according to the available data) and Abstracts Views on Vision4Press platform.
Data correspond to usage on the plateform after 2015. The current usage metrics is available 48-96 hours after online publication and is updated daily on week days.
Initial download of the metrics may take a while.