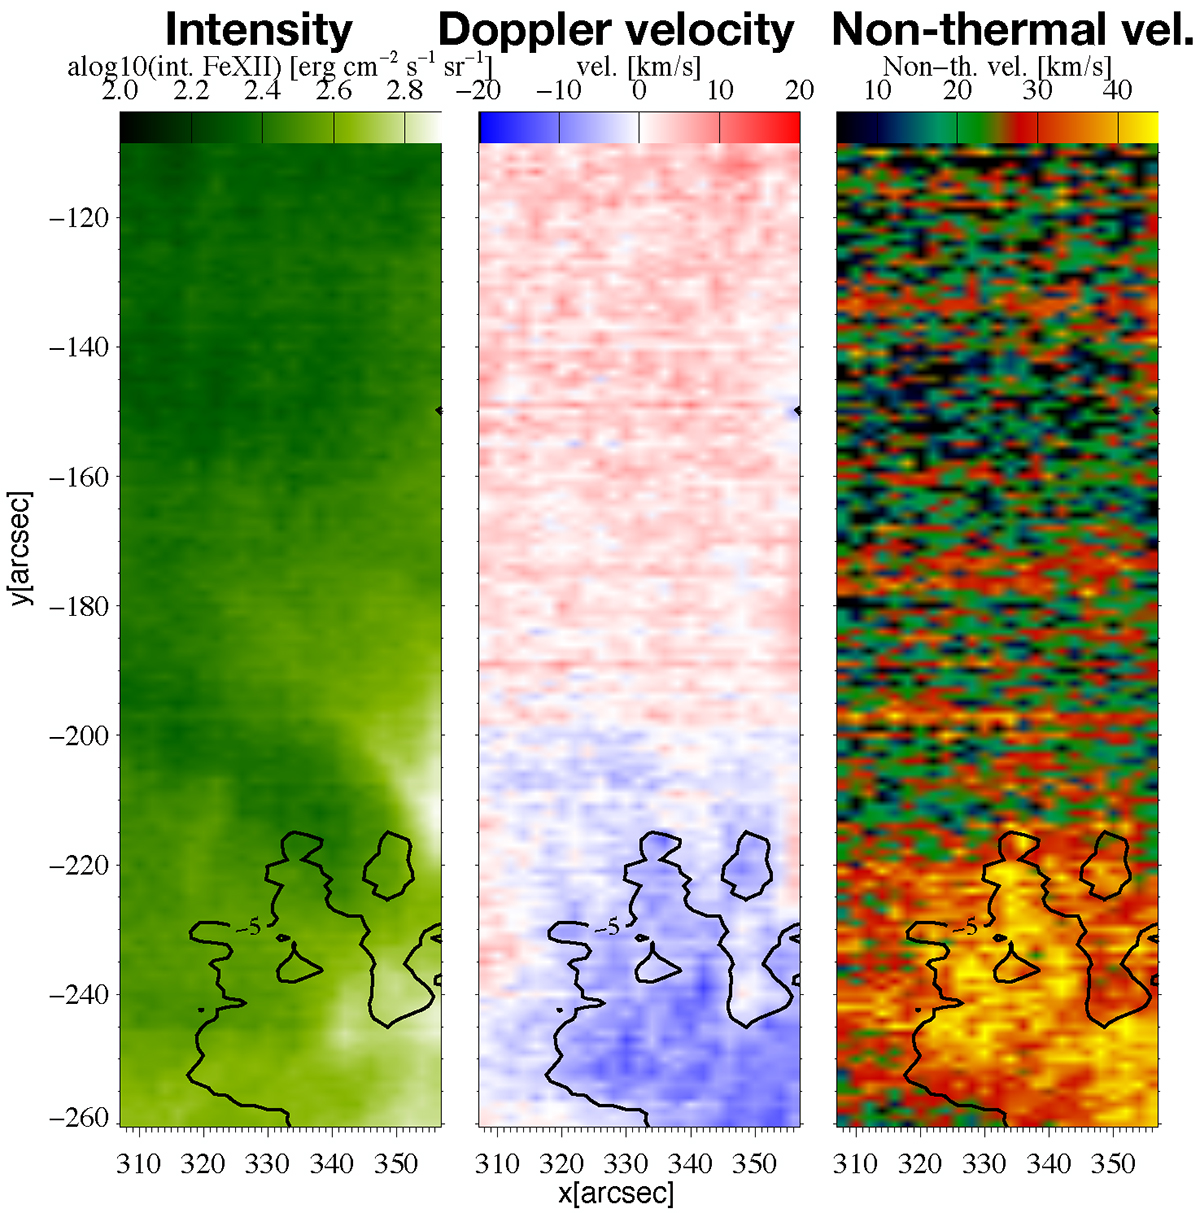
Fig. 2.
Download original image
Coronal upflow region as observed with Hinode/EIS on 30 March 2022 at 00:32 UT. The panels show the intensity (left column), Doppler velocity (middle column), and non-thermal velocity (right column) in the Fe XII emission line (1.0 MK). Black contours represent a Doppler velocity of −5 km s−1. An area with Doppler velocities v < −5 km s−1 is defined as an upflow region.
Current usage metrics show cumulative count of Article Views (full-text article views including HTML views, PDF and ePub downloads, according to the available data) and Abstracts Views on Vision4Press platform.
Data correspond to usage on the plateform after 2015. The current usage metrics is available 48-96 hours after online publication and is updated daily on week days.
Initial download of the metrics may take a while.