Fig. 1.
Download original image
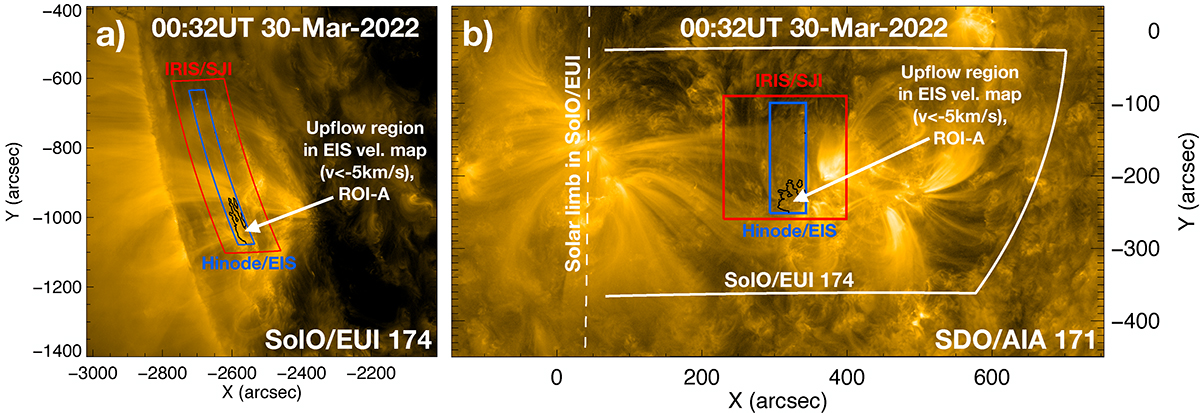
Overview of the active region observations from Solar Orbiter/EUI and HRIEUV telescope at 174 Å (a) and AIA 171 Å (b). The IRIS/SJI and Hinode/EIS FOVs are marked with red and blue boxes, respectively. The black contour highlights the ROI-A that spatially corresponds to the Hinode/EIS upflow region defined in Fig. 2. In panel b, the white line presents the solar disk limb position from panel a computed with the WCS_LIMB solar software routine and then transformed into the SDO/AIA view. The limb observed in EUI/FSI 174 Å (panel a) is marked by a dashed line in the 171 Å map (panel b).
Current usage metrics show cumulative count of Article Views (full-text article views including HTML views, PDF and ePub downloads, according to the available data) and Abstracts Views on Vision4Press platform.
Data correspond to usage on the plateform after 2015. The current usage metrics is available 48-96 hours after online publication and is updated daily on week days.
Initial download of the metrics may take a while.