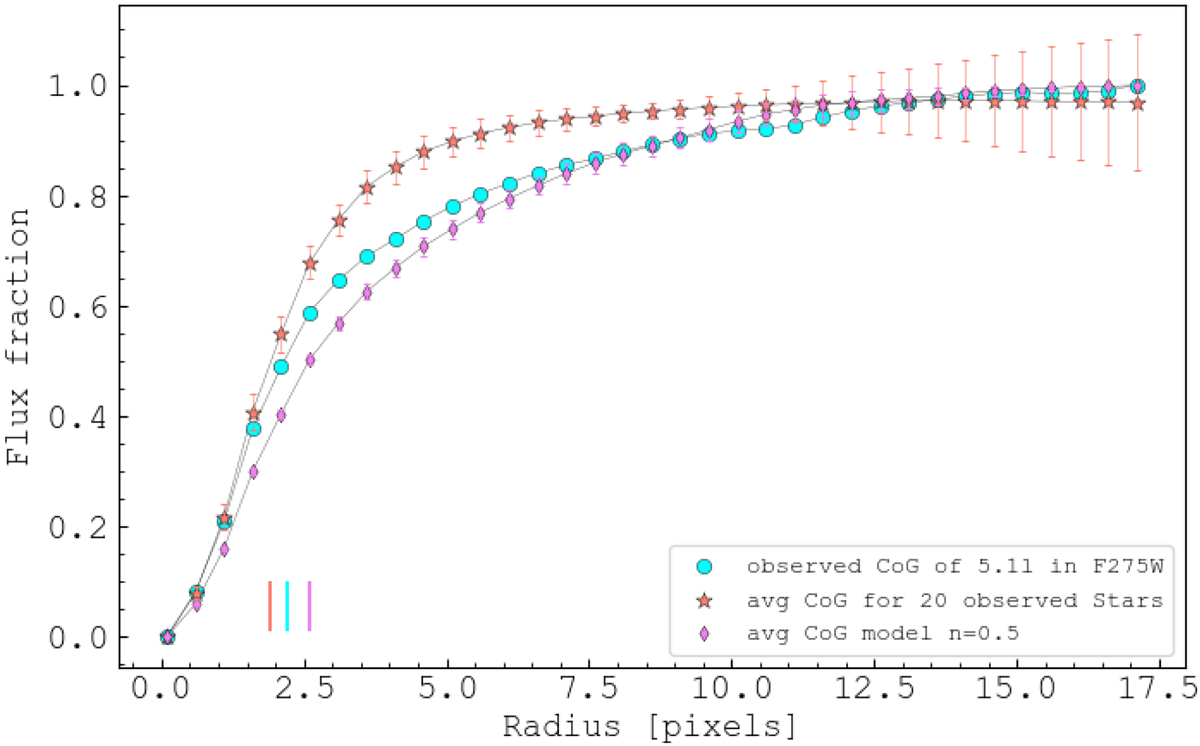
Fig. 7.
Download original image
Three curves of growth normalized to 1. The cyan CoG corresponds to source 5.1l leaking LyC that is located in the Sunburst arc (F275W band). The violet CoG is the PSF-convolved best-fit model of source 5.1l observed in F555W, constructed by averaging 5 CoGs (see text for more details). The orange growth curve is used for comparison and was constructed by averaging 20 single CoGs from randomly selected stars. In both cases (cyan and violet), the error bars are 1σ. Vertical lines in the bottom left part of the panel mark the pixel radii within which 50% of the light is enclosed. The colors corresponds to the CoG colors.
Current usage metrics show cumulative count of Article Views (full-text article views including HTML views, PDF and ePub downloads, according to the available data) and Abstracts Views on Vision4Press platform.
Data correspond to usage on the plateform after 2015. The current usage metrics is available 48-96 hours after online publication and is updated daily on week days.
Initial download of the metrics may take a while.