Fig. 5.
Download original image
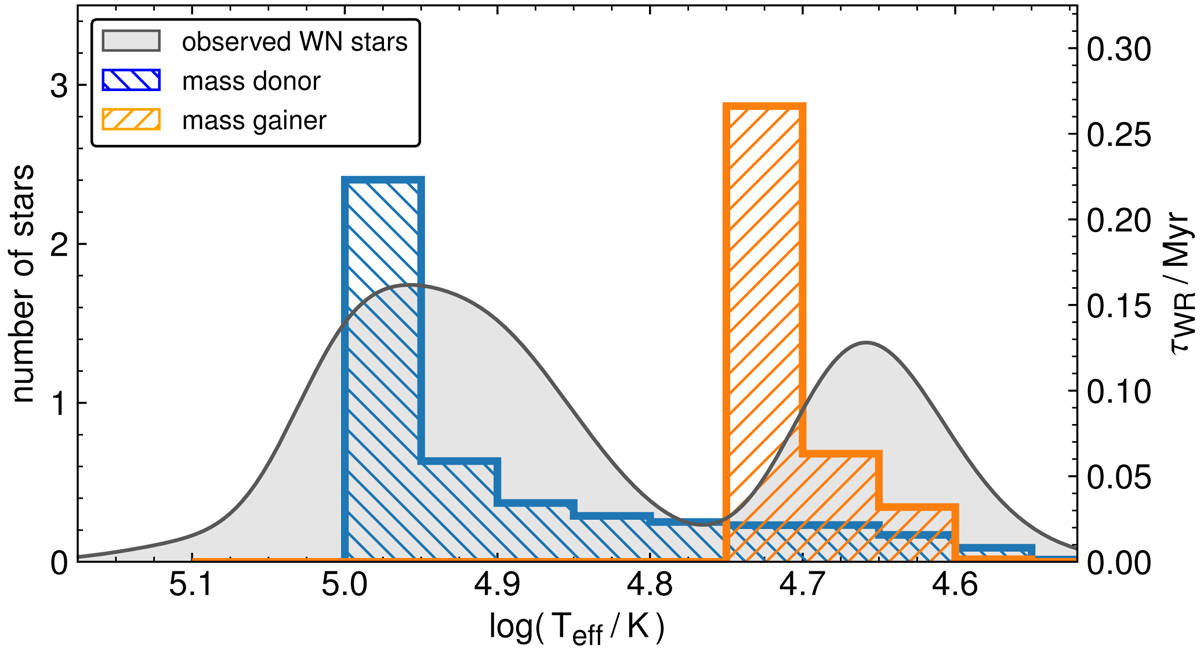
Observed temperature distribution of the WR stars in the SMC (gray area) compared to the time our evolutionary model of the primary (blue) and secondary (orange) are predicted to spend in the different temperature ranges during their WR phase. The observations are shown as Gaussians that have standard deviations corresponding to the observational uncertainties (see Table G.1). We excluded the binary SMC AB5 from this plot, as it has a different evolutionary origin.
Current usage metrics show cumulative count of Article Views (full-text article views including HTML views, PDF and ePub downloads, according to the available data) and Abstracts Views on Vision4Press platform.
Data correspond to usage on the plateform after 2015. The current usage metrics is available 48-96 hours after online publication and is updated daily on week days.
Initial download of the metrics may take a while.