Fig. 4.
Download original image
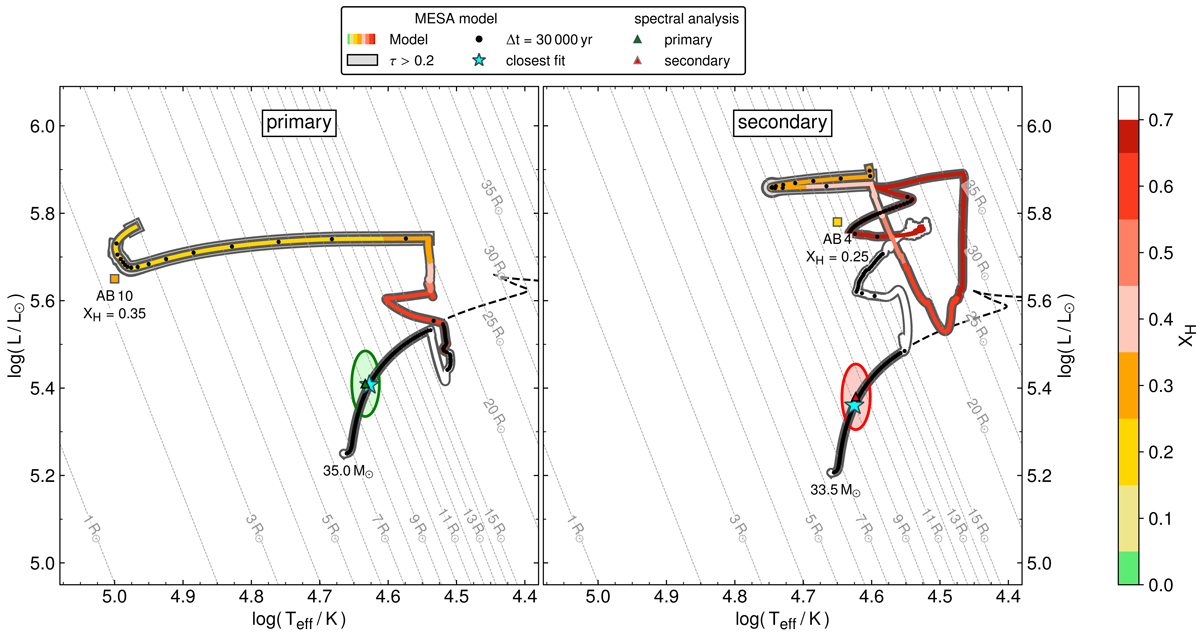
Evolutionary tracks of the primary (left) and secondary (right) compared to the empirical positions of AzV 14 (triangles with error ellipses). The evolutionary tracks are color-coded by the surface hydrogen abundance of the model and are overlayed by black dots corresponding to equidistant time-steps of 0.3 Myr. In the background, single star tracks are shown as dashed black lines. The instance of time in which the model is closest to the observations is marked by blue stars. The tracks are labeled by their initial stellar masses. The phases during which the model is expected to be observed as WR star, this is where τ ≥ 0.2, are highlighted by bold black frames. In addition, the positions of the WR stars AB 10 and AB 4, are marked by squares which are color-coded according to their observed surface-hydrogen abundances.
Current usage metrics show cumulative count of Article Views (full-text article views including HTML views, PDF and ePub downloads, according to the available data) and Abstracts Views on Vision4Press platform.
Data correspond to usage on the plateform after 2015. The current usage metrics is available 48-96 hours after online publication and is updated daily on week days.
Initial download of the metrics may take a while.