Fig. 3.
Download original image
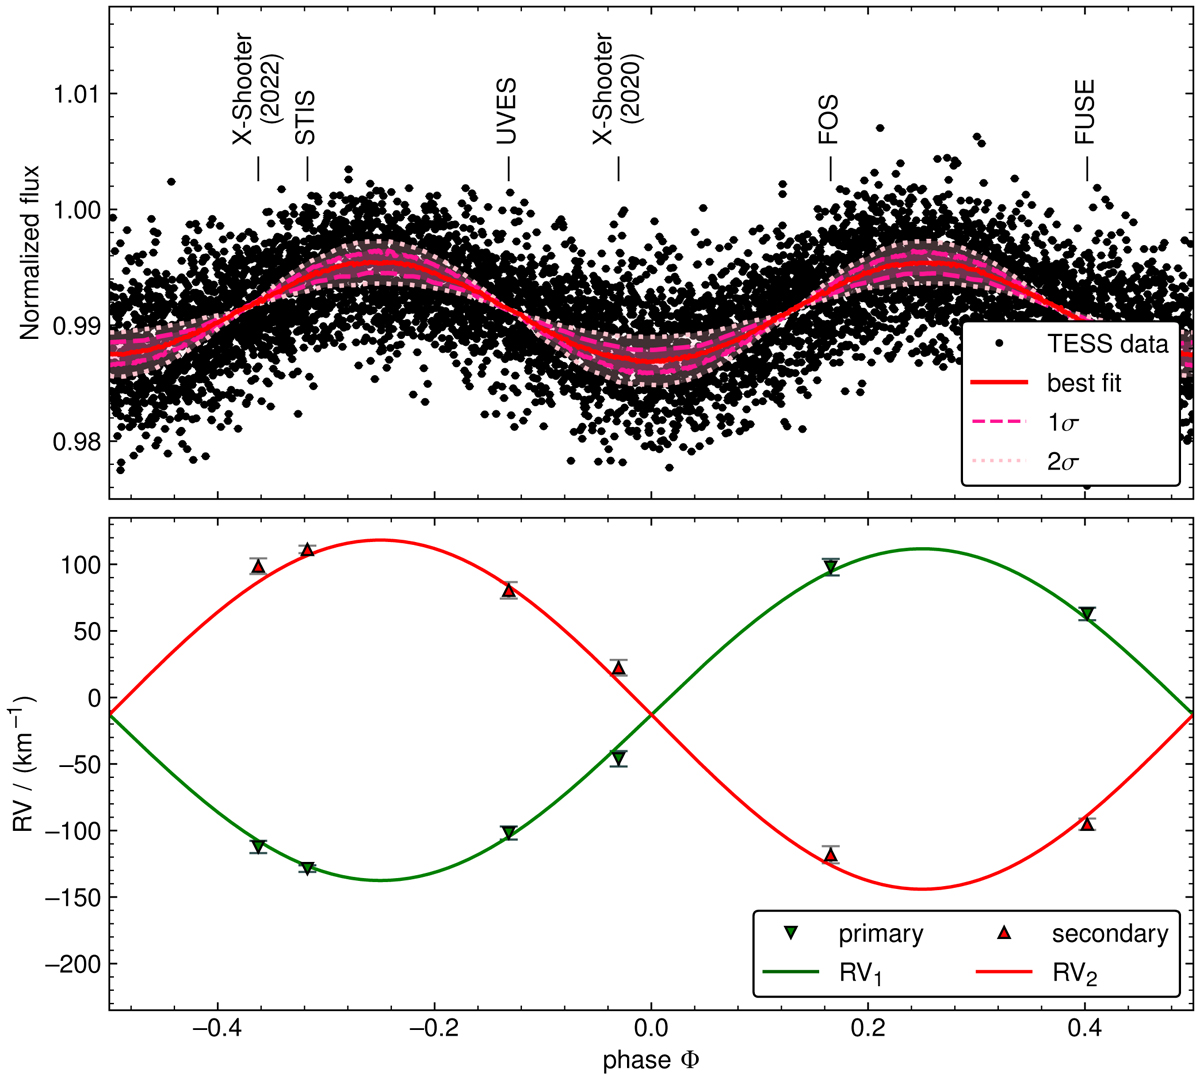
Comparison of the phased observed and synthetic light and RV curve of AzV 14. Upper panel: phased TESS light curve (dots) and best fit obtained with the PHOEBE code (red line). For the PHOEBE model we show the 1σ and 2σ deviations as pink shaded areas. Lower panel: observed (triangles) and fitted RV curves (solid lines) of the primary (green) and secondary (red) component.
Current usage metrics show cumulative count of Article Views (full-text article views including HTML views, PDF and ePub downloads, according to the available data) and Abstracts Views on Vision4Press platform.
Data correspond to usage on the plateform after 2015. The current usage metrics is available 48-96 hours after online publication and is updated daily on week days.
Initial download of the metrics may take a while.