Fig. D.5.
Download original image
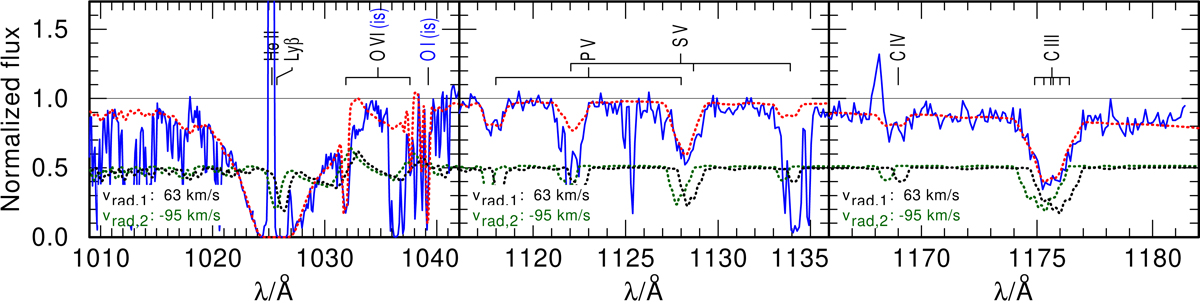
Close-up view of the important diagnostic lines in the far-UV FUSE spectrum. The observed spectrum is shown as a blue solid line, the weighted synthetic spectrum of the primary and secondary are shown as black dotted and green dotted lines and the combined synthetic spectrum is shown as a dashed red line. In the combined synthetic spectrum ISM absorption lines, which originate from the Galactic foreground and in the SMC, are included. They are labeled as “(is)”. We note that not all ISM lines are modeled, and that FUSE spectra are additionally contaminated by absorption lines from molecular hydrogen.
Current usage metrics show cumulative count of Article Views (full-text article views including HTML views, PDF and ePub downloads, according to the available data) and Abstracts Views on Vision4Press platform.
Data correspond to usage on the plateform after 2015. The current usage metrics is available 48-96 hours after online publication and is updated daily on week days.
Initial download of the metrics may take a while.