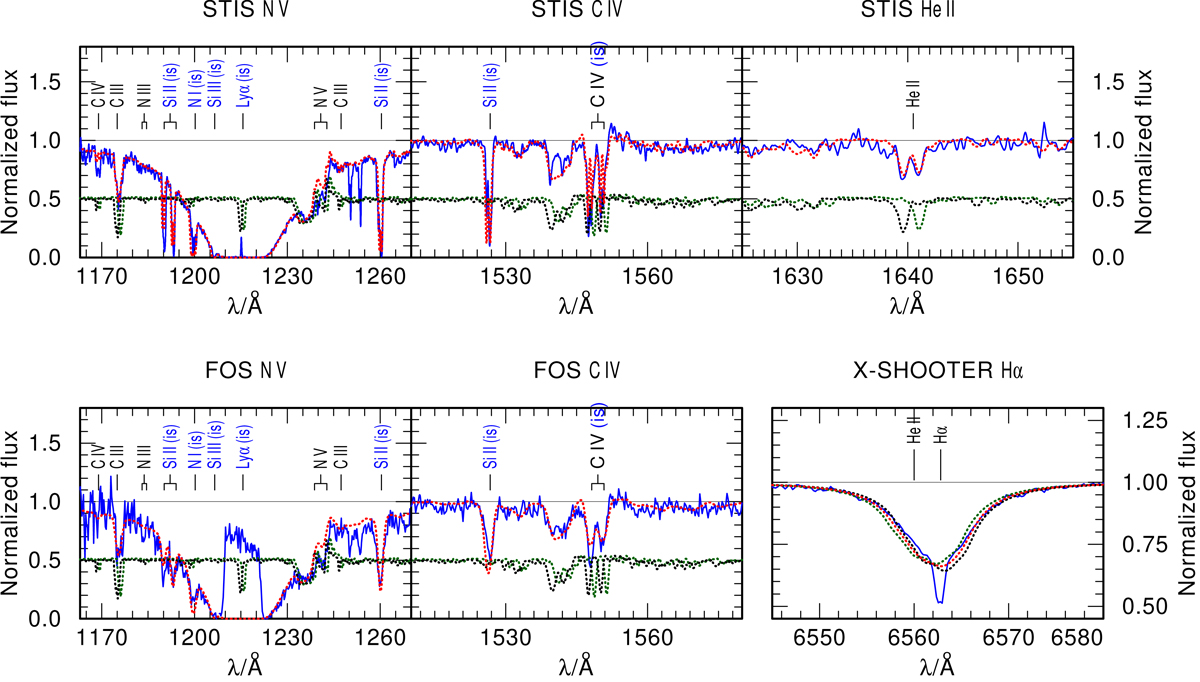
Fig. D.4.
Download original image
Close-up view of the wind diagnostic lines in the STIS and FOS spectra, as well as Hα, which is part of the X-Shooter (2020) spectrum. The observed spectrum is shown in blue and needs to be compared to the combined synthetic spectrum, shown in red. In the combined synthetic spectrum ISM absorption lines, which originate from the Galactic foreground and in the SMC, are included and labeled as “(is)”. For the STIS and FOS spectrum we plot the weighted synthetic spectra. For the X-Shooter (2020) spectrum we show the unweighted synthetic spectra of the primary and the secondary as black dotted and green dotted lines, respectively. A close-up view of the He IIλ4686 wind diagnostic line can be found in Fig. D.1.
Current usage metrics show cumulative count of Article Views (full-text article views including HTML views, PDF and ePub downloads, according to the available data) and Abstracts Views on Vision4Press platform.
Data correspond to usage on the plateform after 2015. The current usage metrics is available 48-96 hours after online publication and is updated daily on week days.
Initial download of the metrics may take a while.