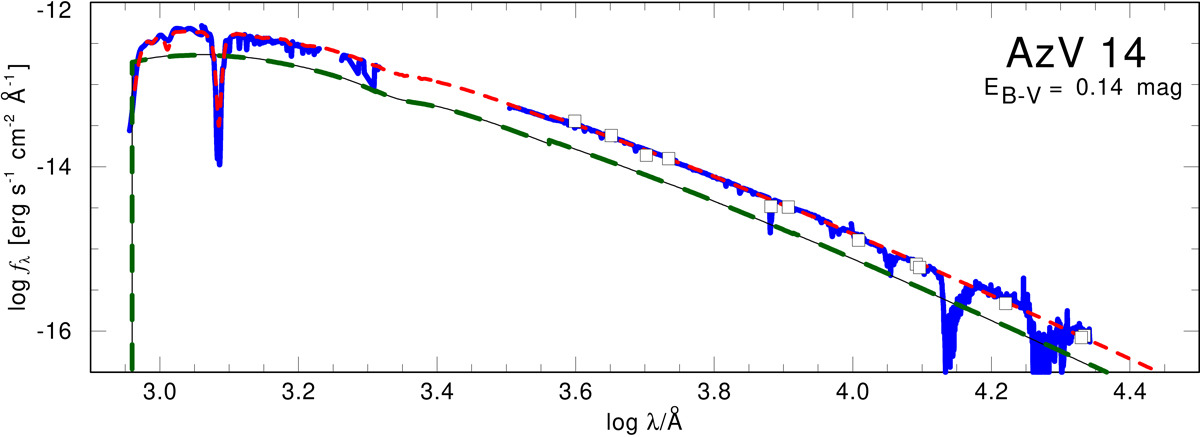
Fig. D.2.
Download original image
SED comparing flux-calibrated observations (blue lines) and photometric data (open squares) to the model SED composed of both binary components (red dashed line). The individual synthetic SEDs of the primary and the secondary are shown as thin black and thick green dashed lines, respectively. Due to their similar luminosities these curves are hard to distinguish.
Current usage metrics show cumulative count of Article Views (full-text article views including HTML views, PDF and ePub downloads, according to the available data) and Abstracts Views on Vision4Press platform.
Data correspond to usage on the plateform after 2015. The current usage metrics is available 48-96 hours after online publication and is updated daily on week days.
Initial download of the metrics may take a while.