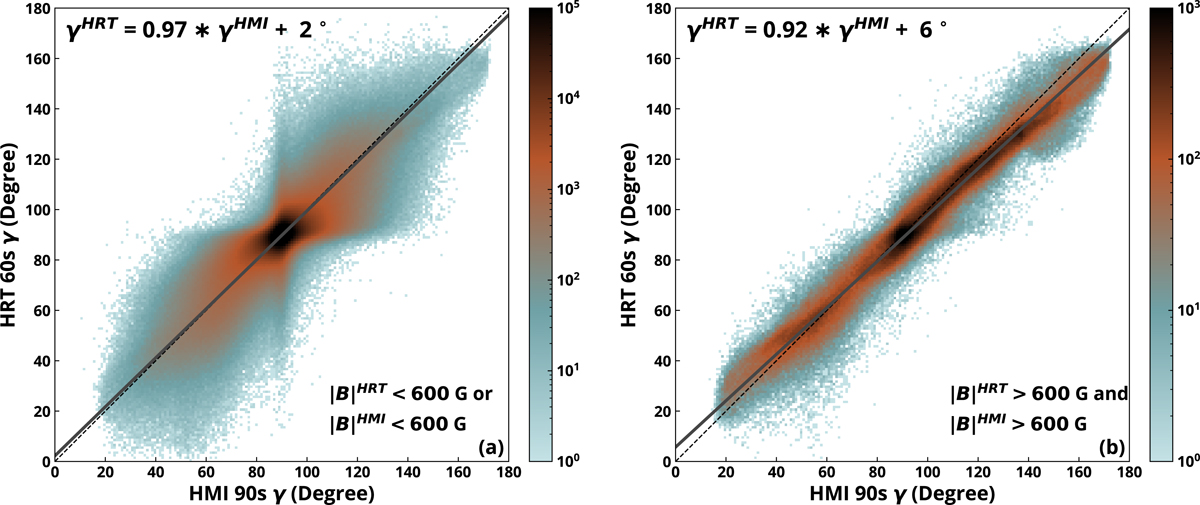
Fig. 4.
Download original image
Scatter plots comparing SO/PHI-HRT 60-second and HMI 90-second magnetic field inclination. Panel a: pixels where |B|HRT < 600 G or |B|HMI < 600 G. Panel b: pixels where |B|HRT > 600 G and |B|HMI > 600 G. The log density of the pixels is shown and is saturated for clarity. The averaged linear fit and y = x are shown with the solid grey and dashed black line, respectively.
Current usage metrics show cumulative count of Article Views (full-text article views including HTML views, PDF and ePub downloads, according to the available data) and Abstracts Views on Vision4Press platform.
Data correspond to usage on the plateform after 2015. The current usage metrics is available 48-96 hours after online publication and is updated daily on week days.
Initial download of the metrics may take a while.