Fig. 1.
Download original image
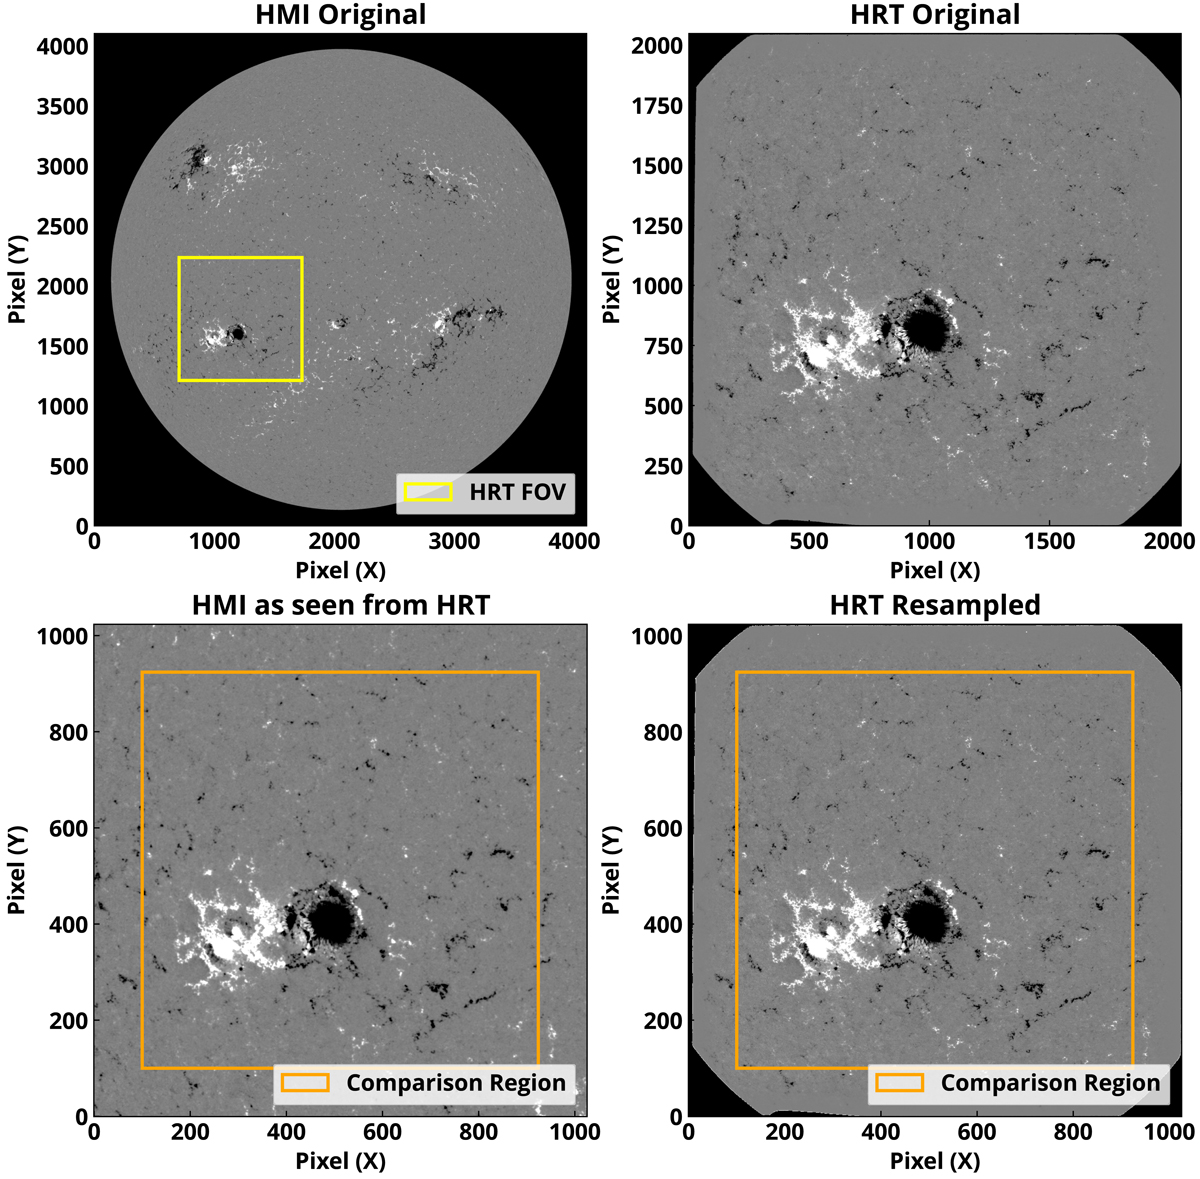
Magnetograms from HMI and SO/PHI-HRT on 7 March 2022. Top left: HMI 45-second LoS magnetogram at 00:01:30 TAI, with the SO/PHI-HRT FoV shown in yellow. The pixels outside the solar disc are set to black for clarity. Top right: SO/PHI-HRT 60-second magnetogram at 00:00:09 UTC. The pixels outside the field stop are set to black for clarity. Bottom left: Sub-region of the HMI magnetogram from the top-left panel, which has been re-projected to the SO/PHI-HRT frame of reference. Bottom right: SO/PHI-HRT magnetogram resampled to HMI resolution. The orange square outlines the regions used for the comparison. All magnetograms are saturated at ±200 G.
Current usage metrics show cumulative count of Article Views (full-text article views including HTML views, PDF and ePub downloads, according to the available data) and Abstracts Views on Vision4Press platform.
Data correspond to usage on the plateform after 2015. The current usage metrics is available 48-96 hours after online publication and is updated daily on week days.
Initial download of the metrics may take a while.