Fig. 7
Download original image
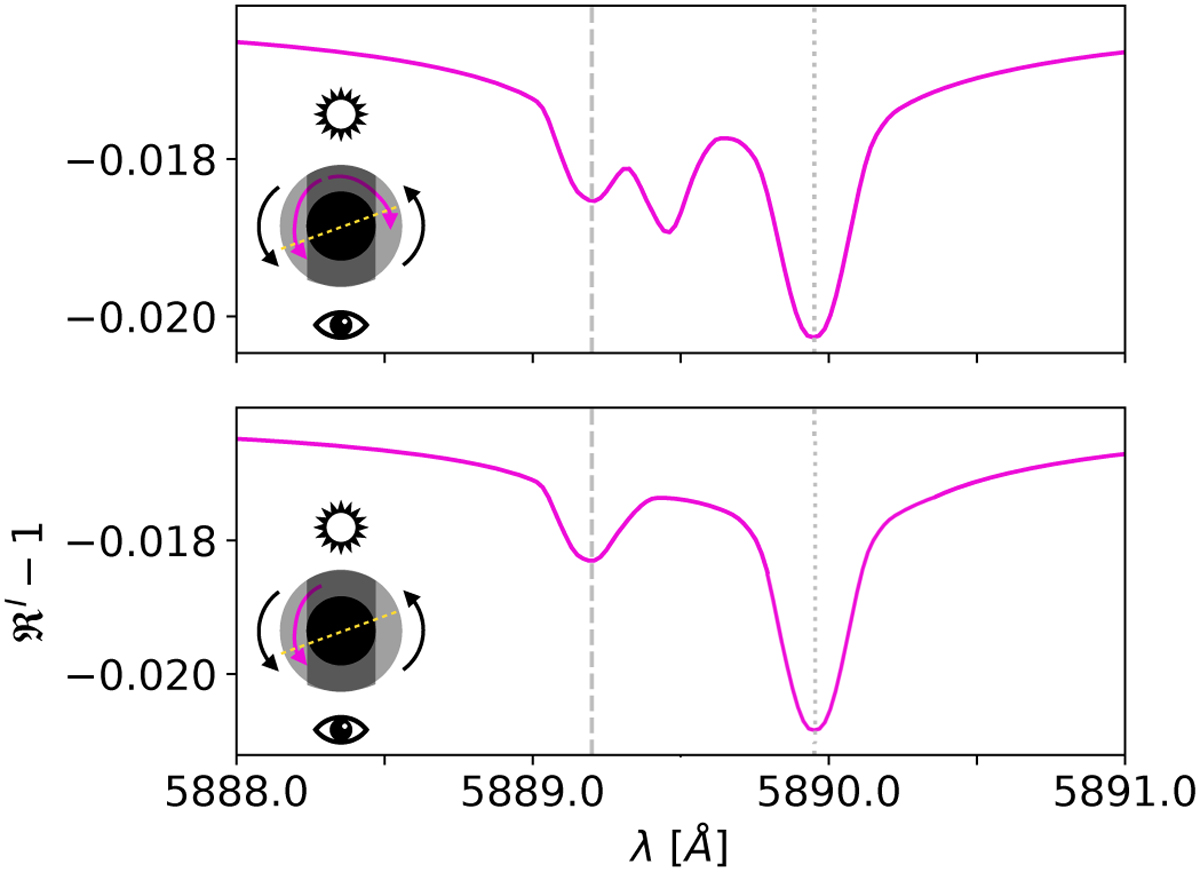
Two models generated with the wind model from MERC for the wavelength range of the sodium D2 line. The position of the sodium line is marked with a dotted grey vertical line. The position of the blueshifted high-velocity absorption components from the egress dataset are marked with a dashed grey vertical line. The lower left corner of each panel shows a sketch of the atmospheric movements. The eye symbolises the observer, the sun the host star, and the black arrows the planetary rotation over each terminator. The scarlet arrows show the direction and existence of atmospheric winds in the lower atmosphere, and the yellow dashed line shows the terminator position to indicate the rotation of the planet with respect to the line of sight for the egress data.
Current usage metrics show cumulative count of Article Views (full-text article views including HTML views, PDF and ePub downloads, according to the available data) and Abstracts Views on Vision4Press platform.
Data correspond to usage on the plateform after 2015. The current usage metrics is available 48-96 hours after online publication and is updated daily on week days.
Initial download of the metrics may take a while.