Fig. 5
Download original image
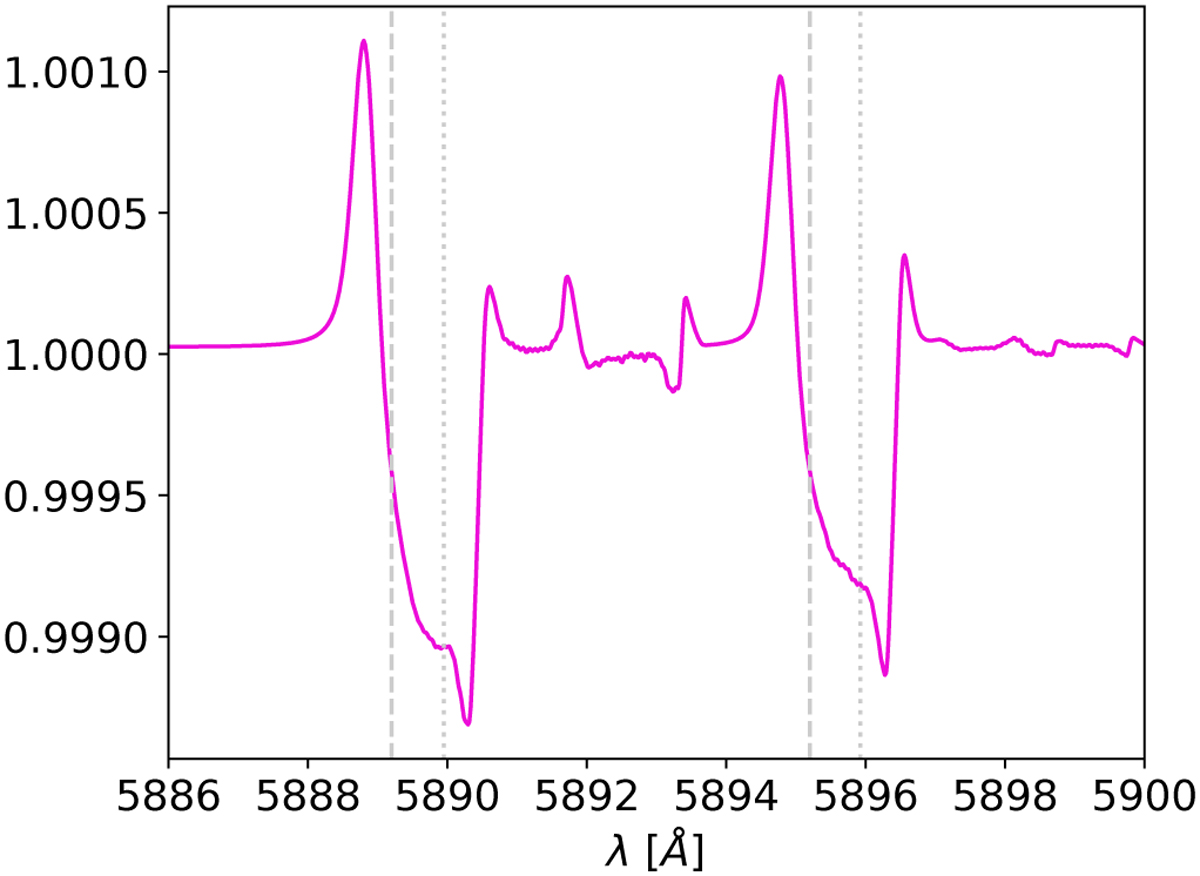
Propagation of RM+CLV model impact for each exposure from Fig. 4 in the final transmission spectrum. The wavelength position of the sodium doublet is indicated as a dotted grey vertical line; the centre of the high-velocity absorption components are indicated as dashed grey vertical lines. The main impact of the RM+CLV correction is at the centre of the sodium doublet, only impacting the mid-centre data and on the blue side of the high-velocity absorption components.
Current usage metrics show cumulative count of Article Views (full-text article views including HTML views, PDF and ePub downloads, according to the available data) and Abstracts Views on Vision4Press platform.
Data correspond to usage on the plateform after 2015. The current usage metrics is available 48-96 hours after online publication and is updated daily on week days.
Initial download of the metrics may take a while.