Fig. 4
Download original image
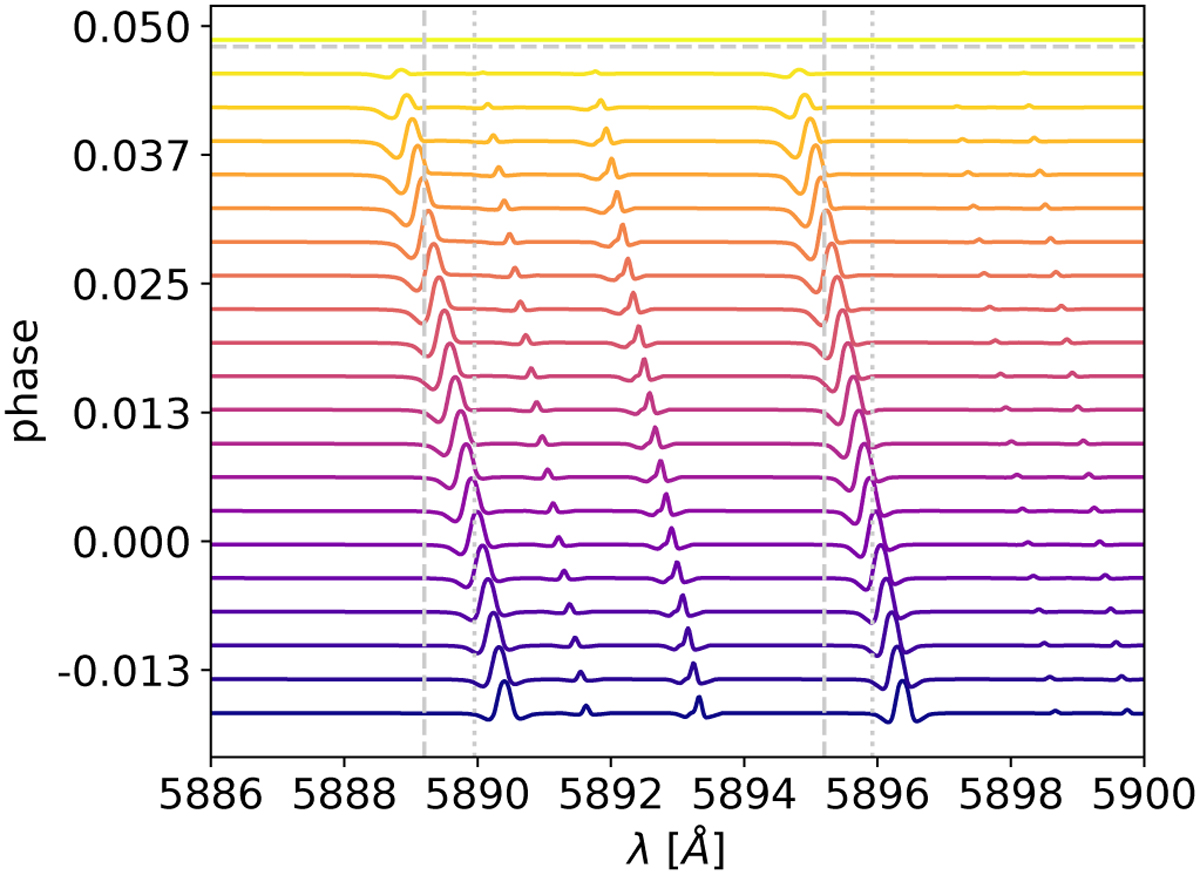
RM+CLV model from Borsa et al. (2021) as a function of phase in the planetary rest frame. The start of the transit is at the bottom; time moves vertically and is emphasised by the colour gradient. The end of the transit is indicated with a dashed, grey horizontal line. The wavelength position of the sodium doublet is indicated as dotted grey vertical lines; the centre of the high-velocity absorption components are indicated as dashed grey vertical lines.
Current usage metrics show cumulative count of Article Views (full-text article views including HTML views, PDF and ePub downloads, according to the available data) and Abstracts Views on Vision4Press platform.
Data correspond to usage on the plateform after 2015. The current usage metrics is available 48-96 hours after online publication and is updated daily on week days.
Initial download of the metrics may take a while.