Fig. 3
Download original image
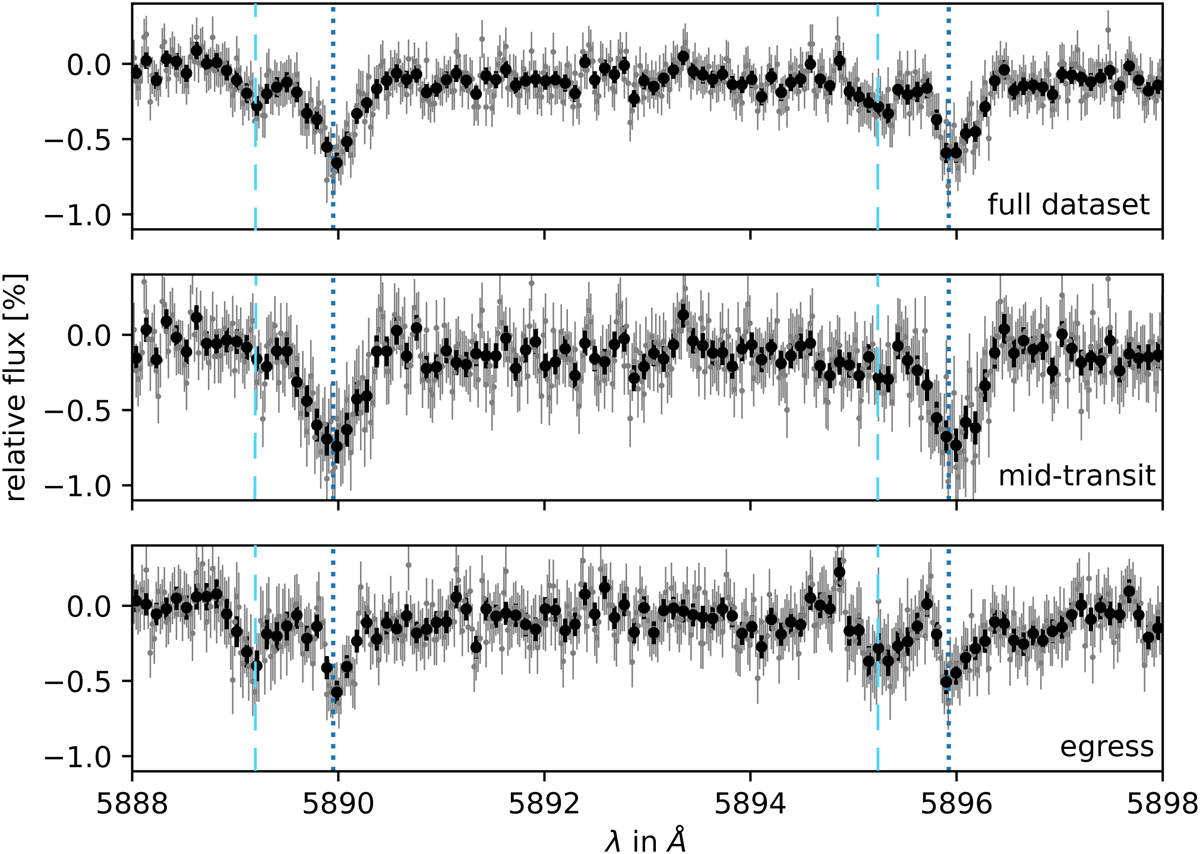
Sodium doublet transmission spectra for the partial 4-UT transit normalised to zero. The top panel shows the full dataset combined, in agreement down to the noise level with Borsa et al. (2021), the central panel shows the mid-transit-centred dataset, and the bottom panel gives the egress-centred dataset. The line centre of the sodium doublet lines are indicated as dotted, blue, vertical lines. The egress data shows a distinct high-velocity absorption feature on the blue side of each sodium doublet line, which is the feature under investigation in this work. The position of this feature is highlighted in each of the three panels by the light blue dashed line.
Current usage metrics show cumulative count of Article Views (full-text article views including HTML views, PDF and ePub downloads, according to the available data) and Abstracts Views on Vision4Press platform.
Data correspond to usage on the plateform after 2015. The current usage metrics is available 48-96 hours after online publication and is updated daily on week days.
Initial download of the metrics may take a while.