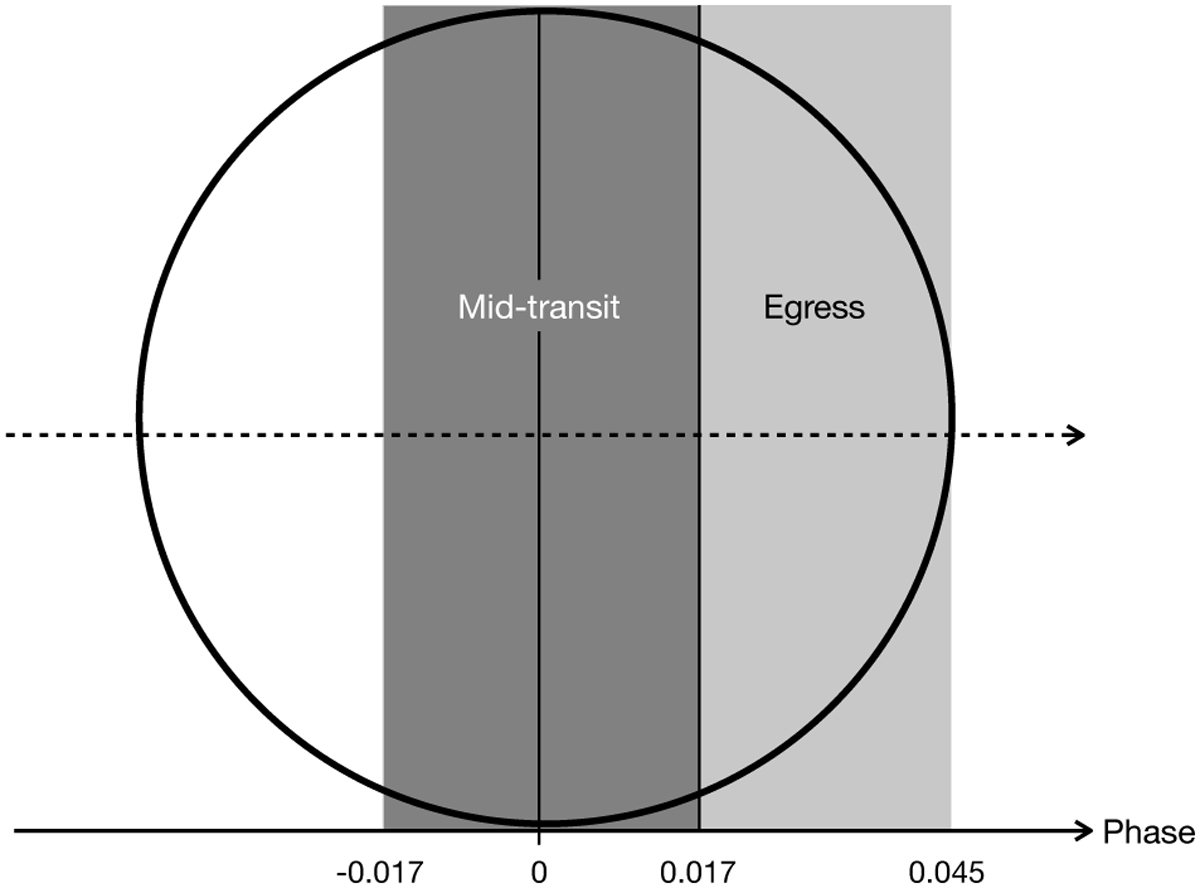
Fig. 1
Download original image
Graphic of data taken and the split into two datasets for the 4-UT ESPRESSO transit. Time is indicated as phase on the x-axis, with the planetary orbit marked as a dashed arrow indicating the direction of movement in time across the stellar disc. The grey areas indicate when exposures where obtained during transit and how the data was split into one set centred around mid-transit (0.0, darker grey, mid-transit dataset) and the other comprising the rest of the exposures towards egress (from here called the egress dataset).
Current usage metrics show cumulative count of Article Views (full-text article views including HTML views, PDF and ePub downloads, according to the available data) and Abstracts Views on Vision4Press platform.
Data correspond to usage on the plateform after 2015. The current usage metrics is available 48-96 hours after online publication and is updated daily on week days.
Initial download of the metrics may take a while.