Fig. 9
Download original image
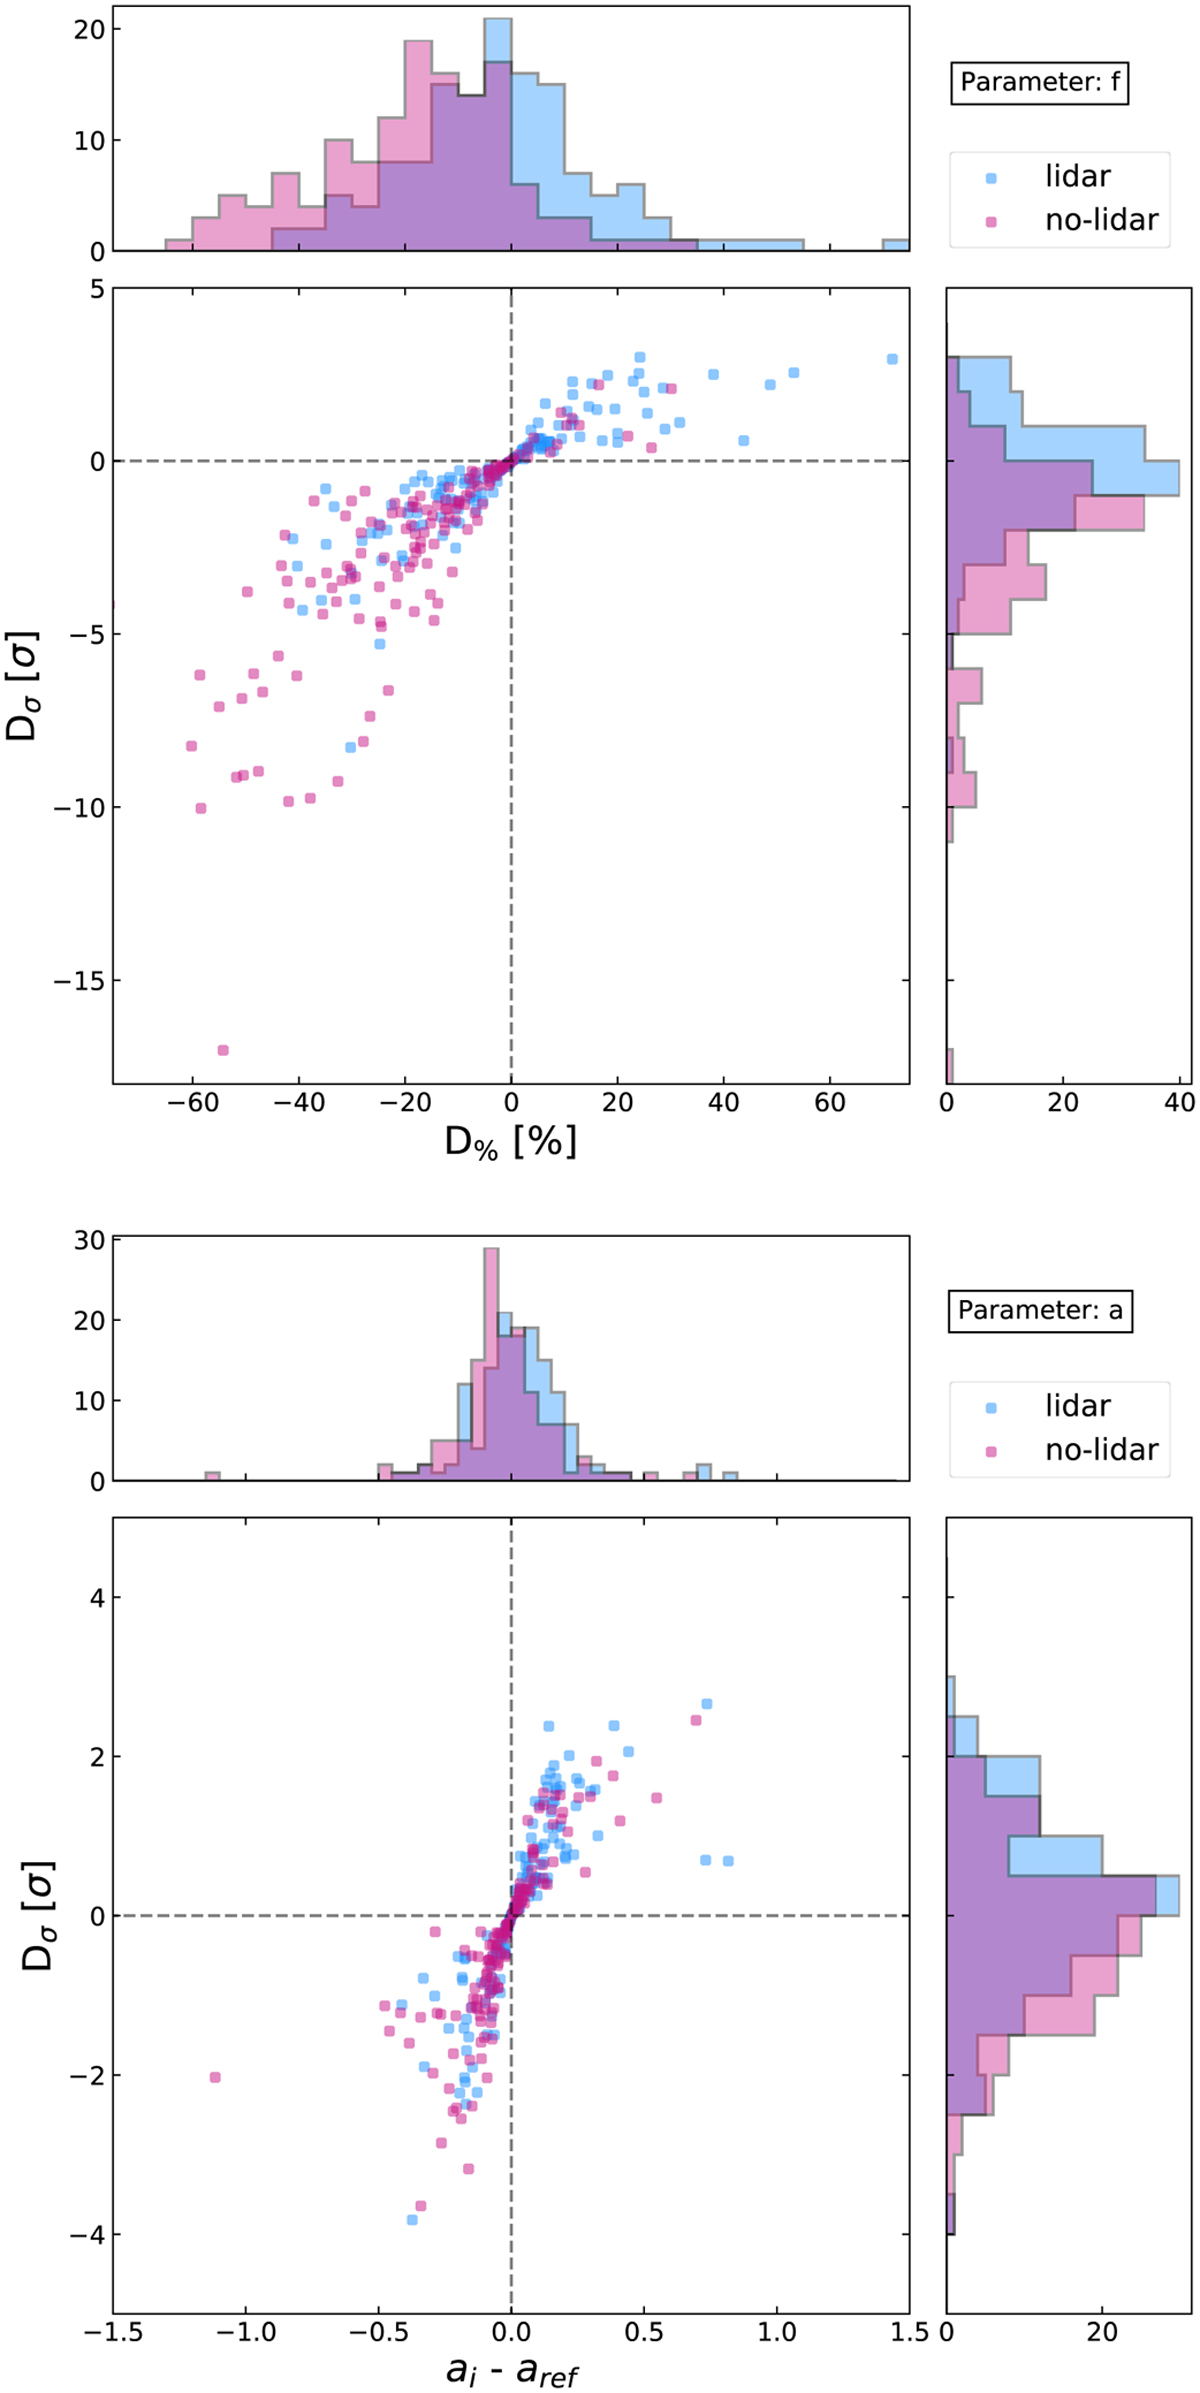
Scatter plots with projected histograms, showing deviations of the spectral parameters of individual nights. Top: Distribution of the percental and statistical deviation of the reconstructed flux normalization obtained from nights with an aerosol transmission between 0.5 and 0.9 from the reference spectrum for individual nights with projected histograms. Bottom: Same for the index parameter but using the difference instead of the percental deviation in the x-axis.
Current usage metrics show cumulative count of Article Views (full-text article views including HTML views, PDF and ePub downloads, according to the available data) and Abstracts Views on Vision4Press platform.
Data correspond to usage on the plateform after 2015. The current usage metrics is available 48-96 hours after online publication and is updated daily on week days.
Initial download of the metrics may take a while.