Fig. 8
Download original image
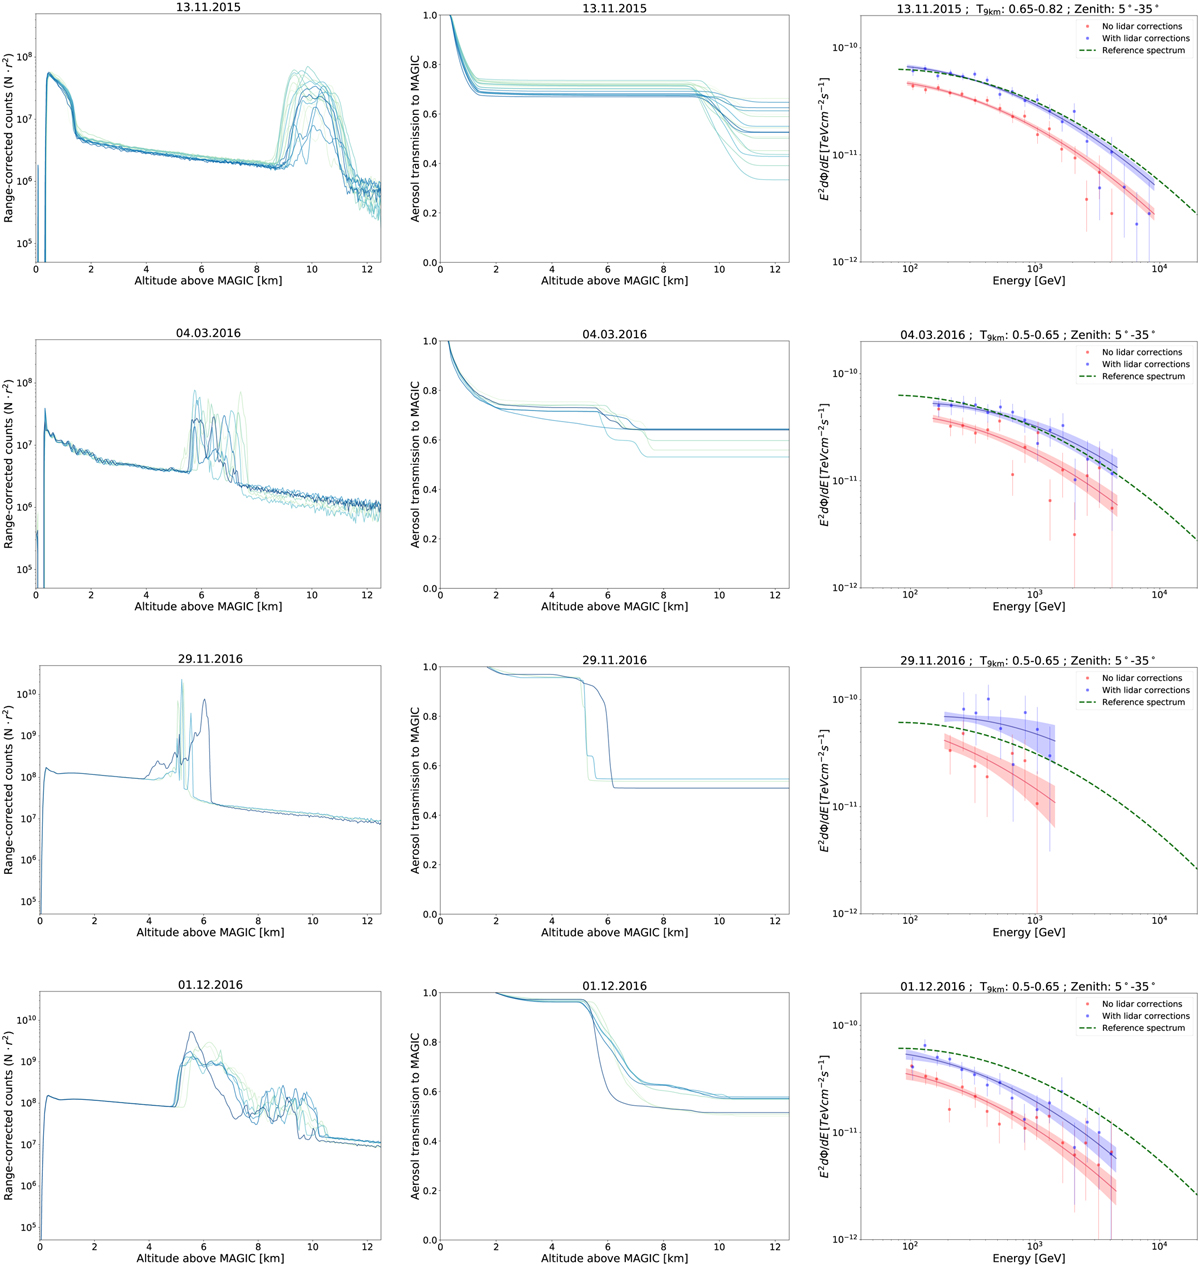
Four example nights that show the effect of the LIDAR corrections. Left column: LIDAR profiles in the form of range-corrected photo-electron counts for four example nights. The consecutive profiles are marked by different color shadings and provide a sample every 4 min. Center column: Resulting integral aerosol transmission curves, Taer(h). Right column: SEDs of concurrent observations of the Crab Nebula shown without (red) and with (blue) LIDAR correction. For comparison, the reference spectrum of the corresponding period is shown as a dashed green line.
Current usage metrics show cumulative count of Article Views (full-text article views including HTML views, PDF and ePub downloads, according to the available data) and Abstracts Views on Vision4Press platform.
Data correspond to usage on the plateform after 2015. The current usage metrics is available 48-96 hours after online publication and is updated daily on week days.
Initial download of the metrics may take a while.