Fig. 6
Download original image
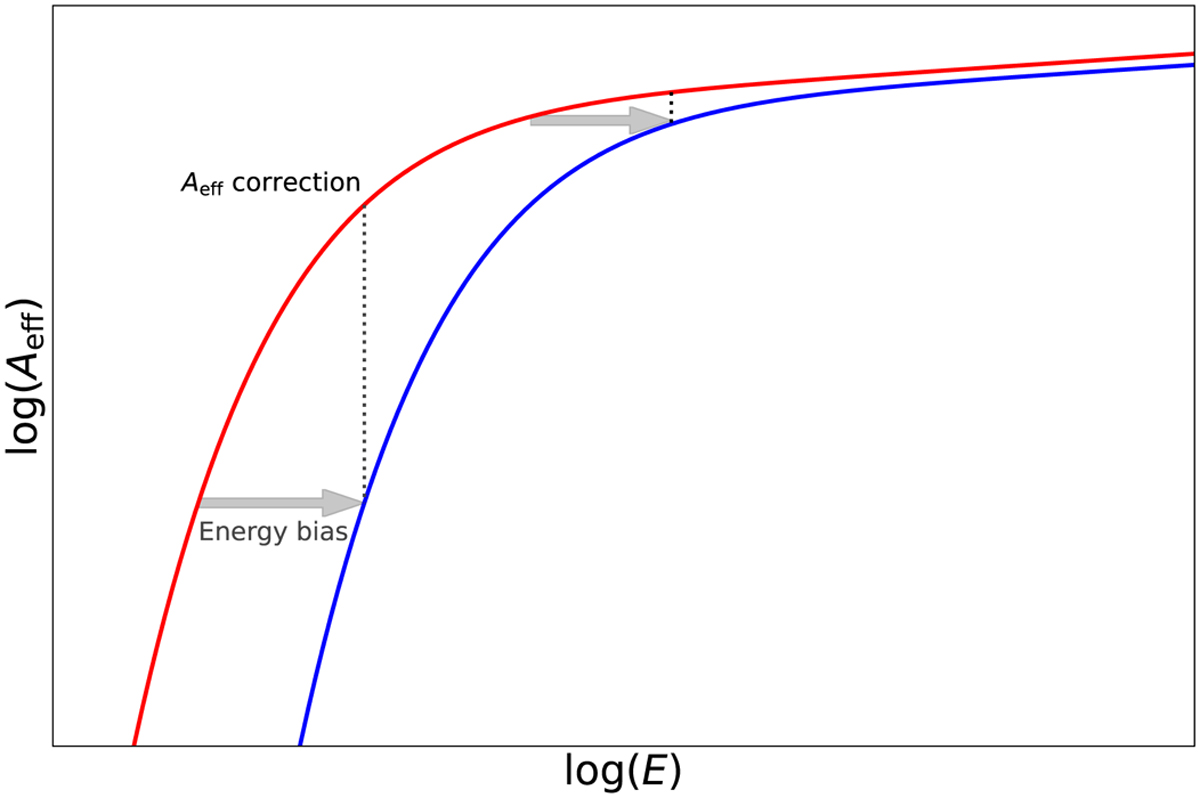
Illustration of the modification of the effective collection area due to strong aerosol extinction as a function of energy. The red line corresponds to the collection area expected for clear nights, whereas the blue line corresponds to the model for unfavorable aerosol conditions. The gray arrows labeled “energy bias” indicate the shift in energy for two example energies.
Current usage metrics show cumulative count of Article Views (full-text article views including HTML views, PDF and ePub downloads, according to the available data) and Abstracts Views on Vision4Press platform.
Data correspond to usage on the plateform after 2015. The current usage metrics is available 48-96 hours after online publication and is updated daily on week days.
Initial download of the metrics may take a while.