Fig. 5
Download original image
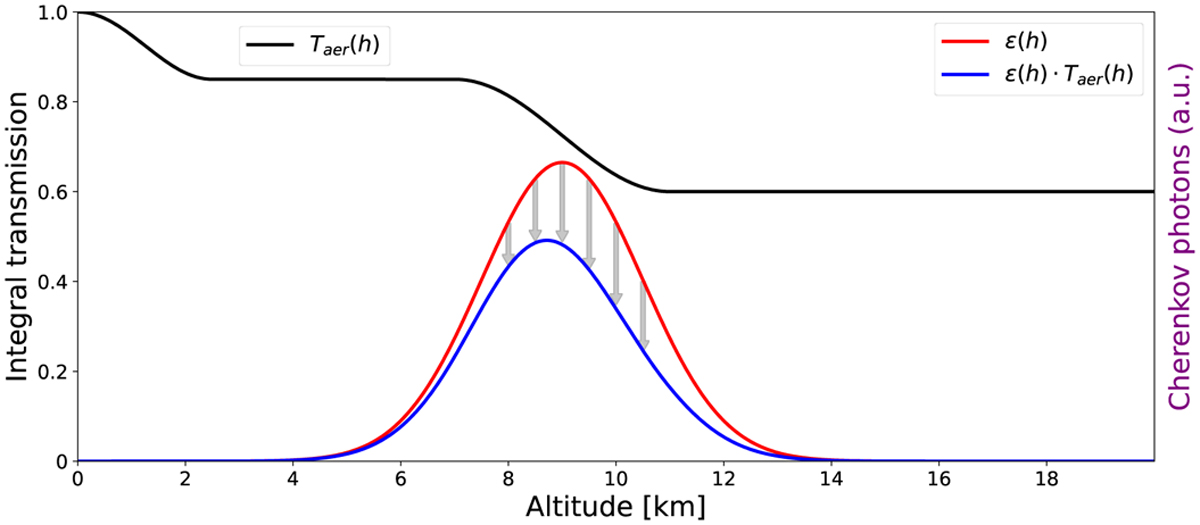
Sketch of the averaging procedure of the aerosol optical depth, Taer, over an assumed air-shower light emission profile. In this case, some aerosol extinction due to the ground layer is shown, and a cloud is located at a typical height of 9 km above ground. The left vertical axis shows Taer, and the right axis denotes the normalized distribution, ϵ(h), of the number of Cherenkov photons that can reach the IACT telescope and camera. In red, ϵ(h) is shown and in blue, the product of ϵ(h) · Taer(h).
Current usage metrics show cumulative count of Article Views (full-text article views including HTML views, PDF and ePub downloads, according to the available data) and Abstracts Views on Vision4Press platform.
Data correspond to usage on the plateform after 2015. The current usage metrics is available 48-96 hours after online publication and is updated daily on week days.
Initial download of the metrics may take a while.