Open Access
Fig. 4
Download original image
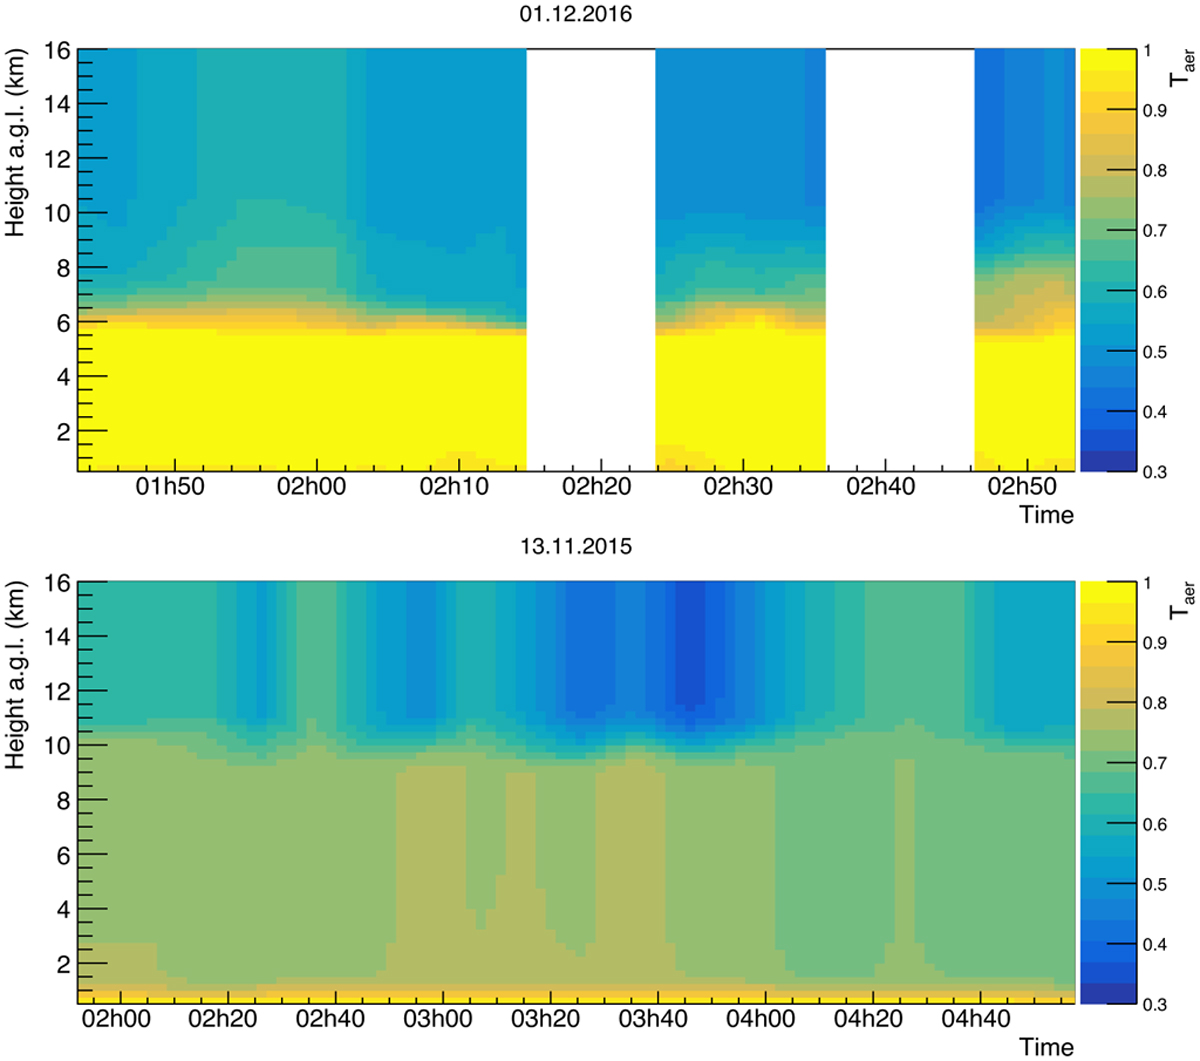
Interpolated aerosol transmission profile, Taer, as a function of height and time. Top: Case of intermittent clouds above 5 km above ground. Bottom: Strong calima in the first kilometer above ground accompanied by a few cirrus clouds above 10 km. The white spaces represent times when the MAGIC telescopes were not observing.
Current usage metrics show cumulative count of Article Views (full-text article views including HTML views, PDF and ePub downloads, according to the available data) and Abstracts Views on Vision4Press platform.
Data correspond to usage on the plateform after 2015. The current usage metrics is available 48-96 hours after online publication and is updated daily on week days.
Initial download of the metrics may take a while.