Open Access
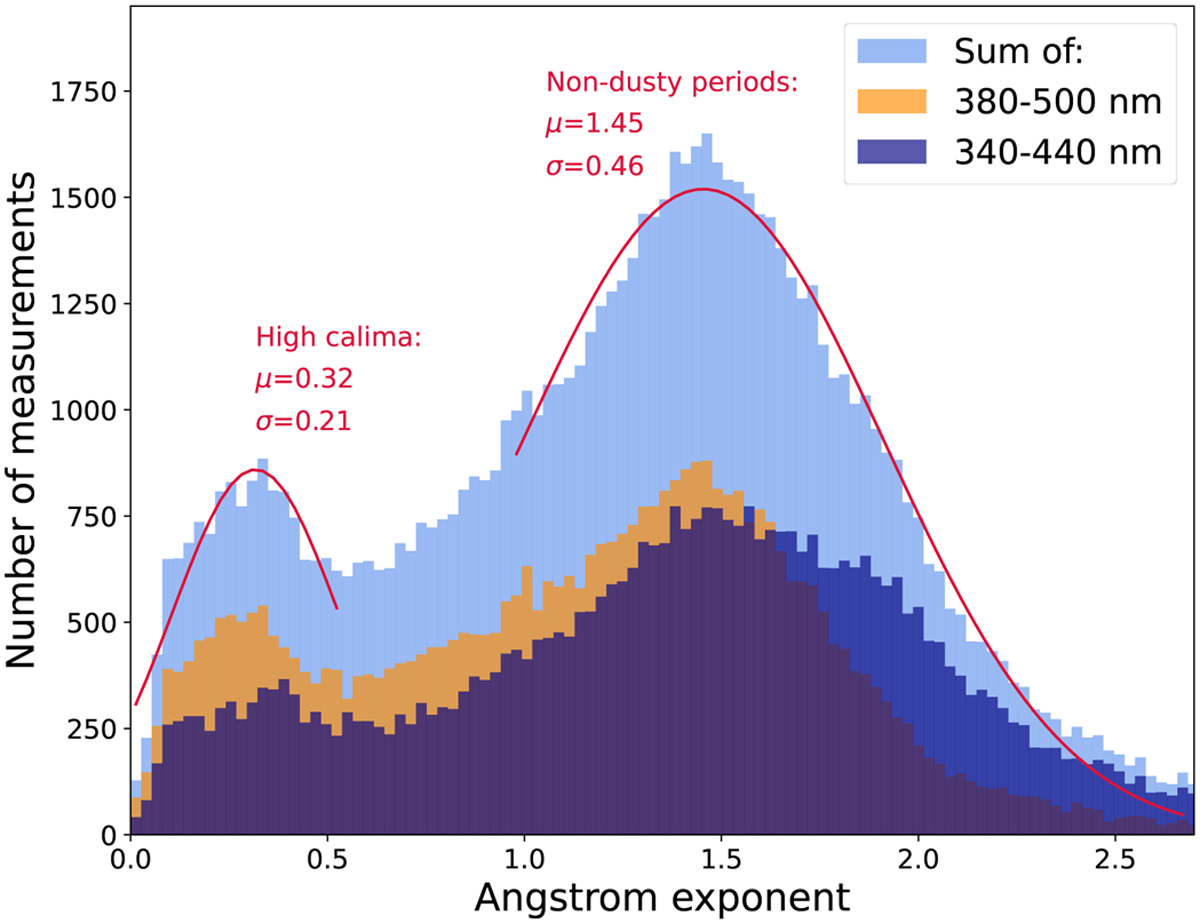
Fig. 3
Download original image
Ångström exponents obtained from the AERONET station at the ORM for two different wavelength regions, as well as the combined histogram fitted with Gaussian distributions. The data cover the period between November 2019 and July 2022.
Current usage metrics show cumulative count of Article Views (full-text article views including HTML views, PDF and ePub downloads, according to the available data) and Abstracts Views on Vision4Press platform.
Data correspond to usage on the plateform after 2015. The current usage metrics is available 48-96 hours after online publication and is updated daily on week days.
Initial download of the metrics may take a while.