Fig. 18
Download original image
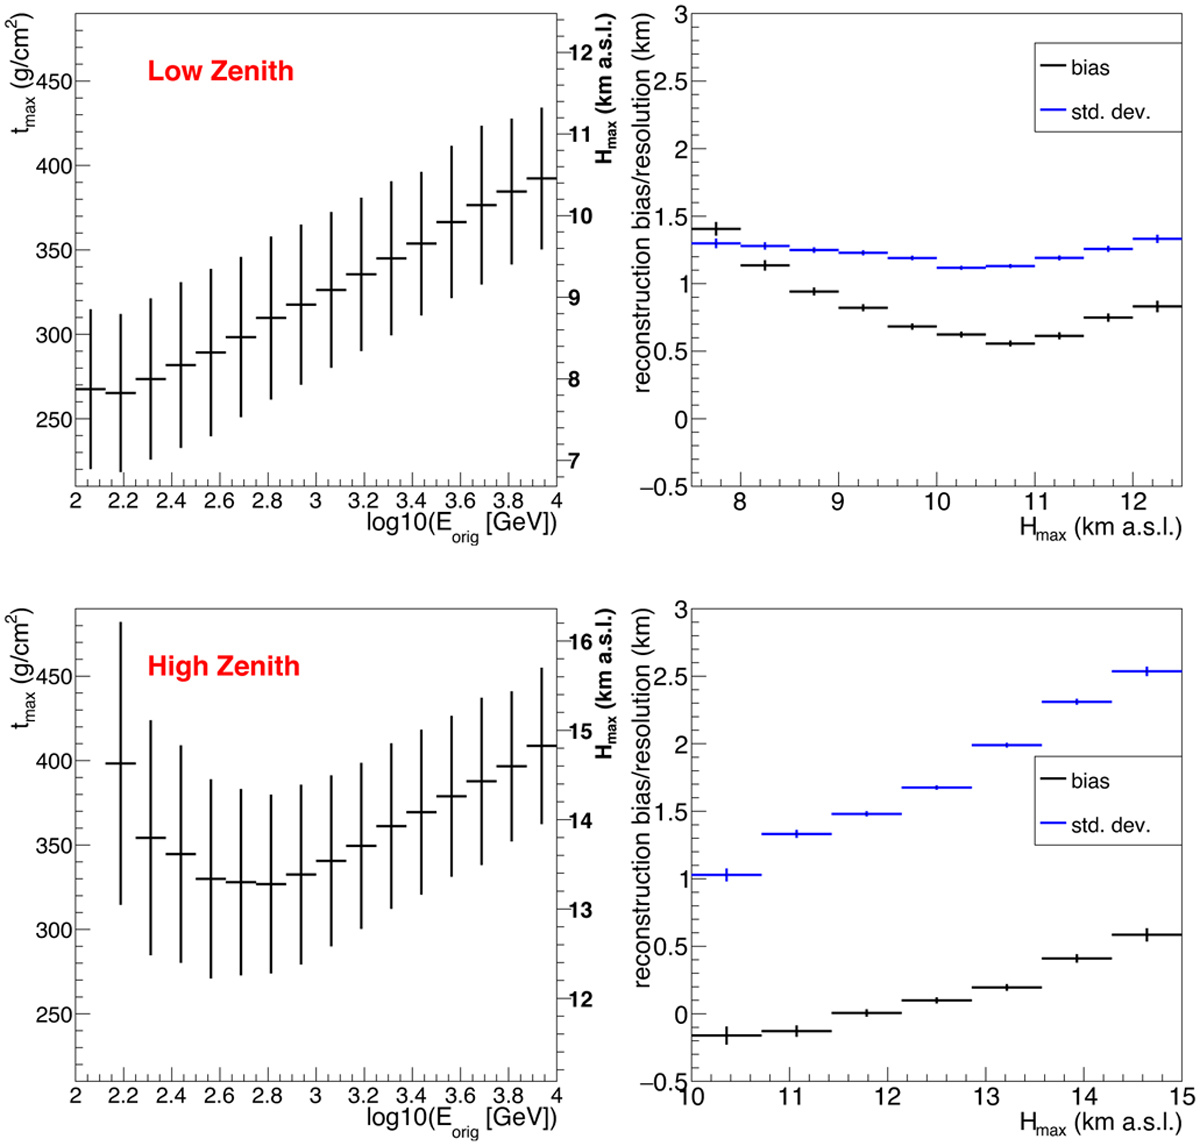
Shower maxima obtained from gamma-ray simulations. Left: Profile of shower maxima as a function of the logarithm of energy. The left axis shows the slant depth traversed and the right axis the corresponding altitude above sea level. Right: Bias and resolution of the reconstructed height of shower maximum as a function of the simulated shower maximum. The top plots show fully detected and reconstructed showers at low zenith angles, below 35°, and the bottom row at high zenith angles, 60°.
Current usage metrics show cumulative count of Article Views (full-text article views including HTML views, PDF and ePub downloads, according to the available data) and Abstracts Views on Vision4Press platform.
Data correspond to usage on the plateform after 2015. The current usage metrics is available 48-96 hours after online publication and is updated daily on week days.
Initial download of the metrics may take a while.