Fig. 17
Download original image
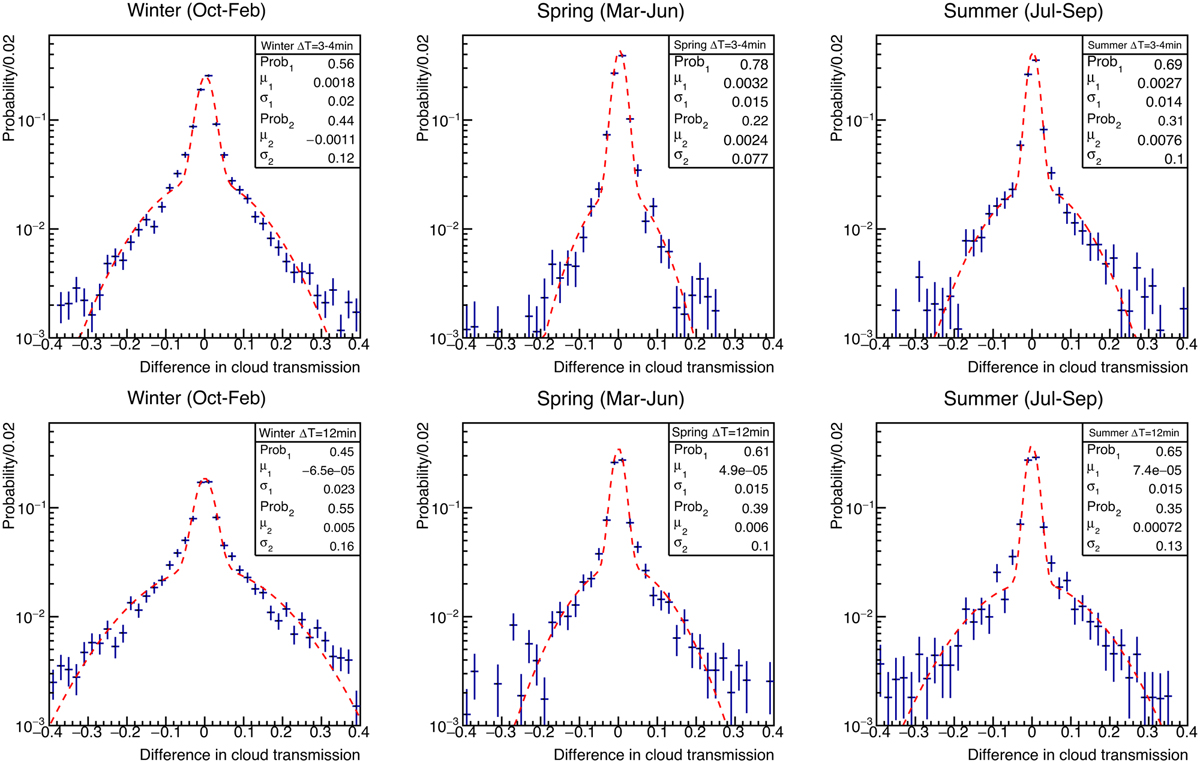
Differences in cloud transmission for LIDAR data sets separated by five or four minutes (top, according to the LIDAR operation schemes before or after 2016; see Fruck et al. 2022), or by 12 min (bottom). The distributions have been separated by seasons: the winter months, where the highest cloud fractions are observed (left); the spring months, with the lowest cloud fraction (center); and the summer months, affected by a subtropical climate and frequent breakdown of the temperature-inversion layer below the observatory (right). All data have been selected such that at least one of the two data sets separated by the given time span contains at least one cloud and both belong to the same tracked sky coordinates. Total cloud transmissions from 12 km above ground down to the end of the ground layer have been compared. The distributions are normalized, meaning no information about the relative occurrence frequency of clouds between seasons can be read from the plots. All distributions have been fit to a double-Gaussian distribution. The narrower Gaussian of the two is interpreted as the LIDAR continuing to observe the same cloud, whereas the wider one may represent cases where one of the two data sets has already missed the cloud. The scales Prob1 and Prob2 show the relative frequency of one or the other case occurring. The bin width of the difference in transmission is 0.02.
Current usage metrics show cumulative count of Article Views (full-text article views including HTML views, PDF and ePub downloads, according to the available data) and Abstracts Views on Vision4Press platform.
Data correspond to usage on the plateform after 2015. The current usage metrics is available 48-96 hours after online publication and is updated daily on week days.
Initial download of the metrics may take a while.