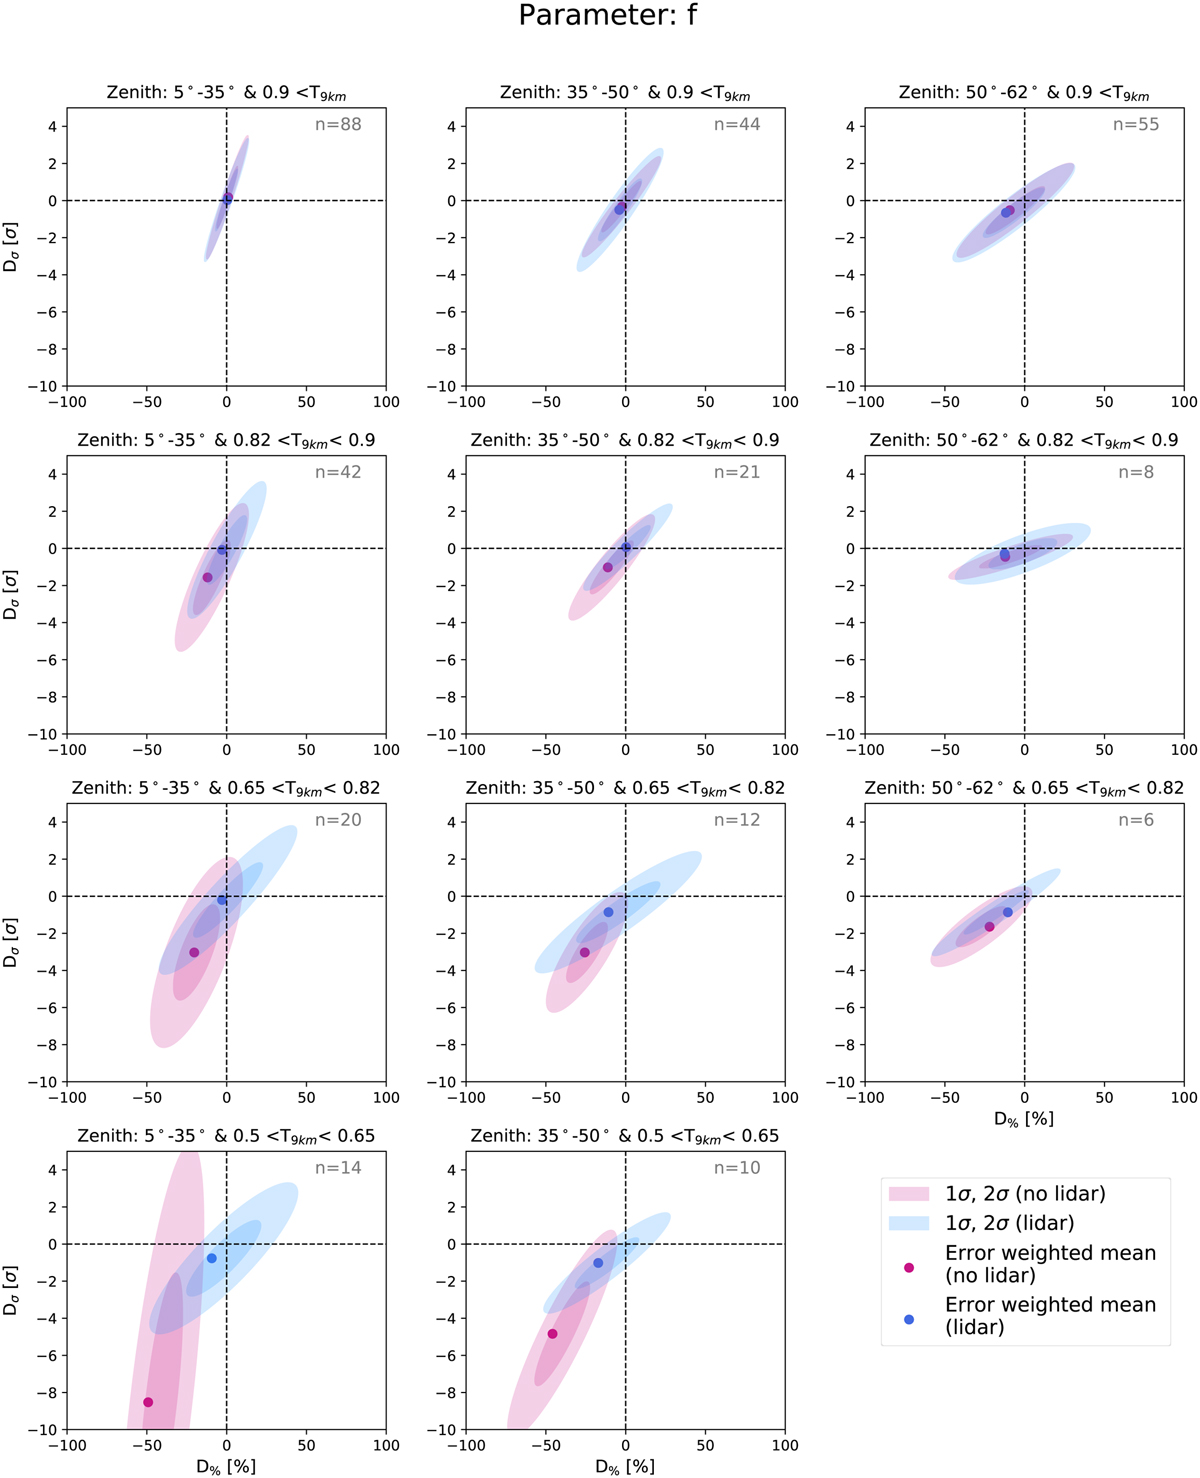
Fig. 10
Download original image
Error-weighted mean percental and mean statistical deviation of the flux normalization parameter, f, without (red dot) and with (blue dot) LIDAR corrections for eight zenith and aerosol transmission T9 km bin combinations. The error ellipses are given by the shaded area. Note that, by construction, the uncertainty ellipses may not pass through the coordinate system origin, reflecting reconstruction biases. The number of averaged nights, n, is provided in the top-right corner of each plot. In the low aerosol transmission and high zenith bin, sufficient data are not available.
Current usage metrics show cumulative count of Article Views (full-text article views including HTML views, PDF and ePub downloads, according to the available data) and Abstracts Views on Vision4Press platform.
Data correspond to usage on the plateform after 2015. The current usage metrics is available 48-96 hours after online publication and is updated daily on week days.
Initial download of the metrics may take a while.