Fig. 7.
Download original image
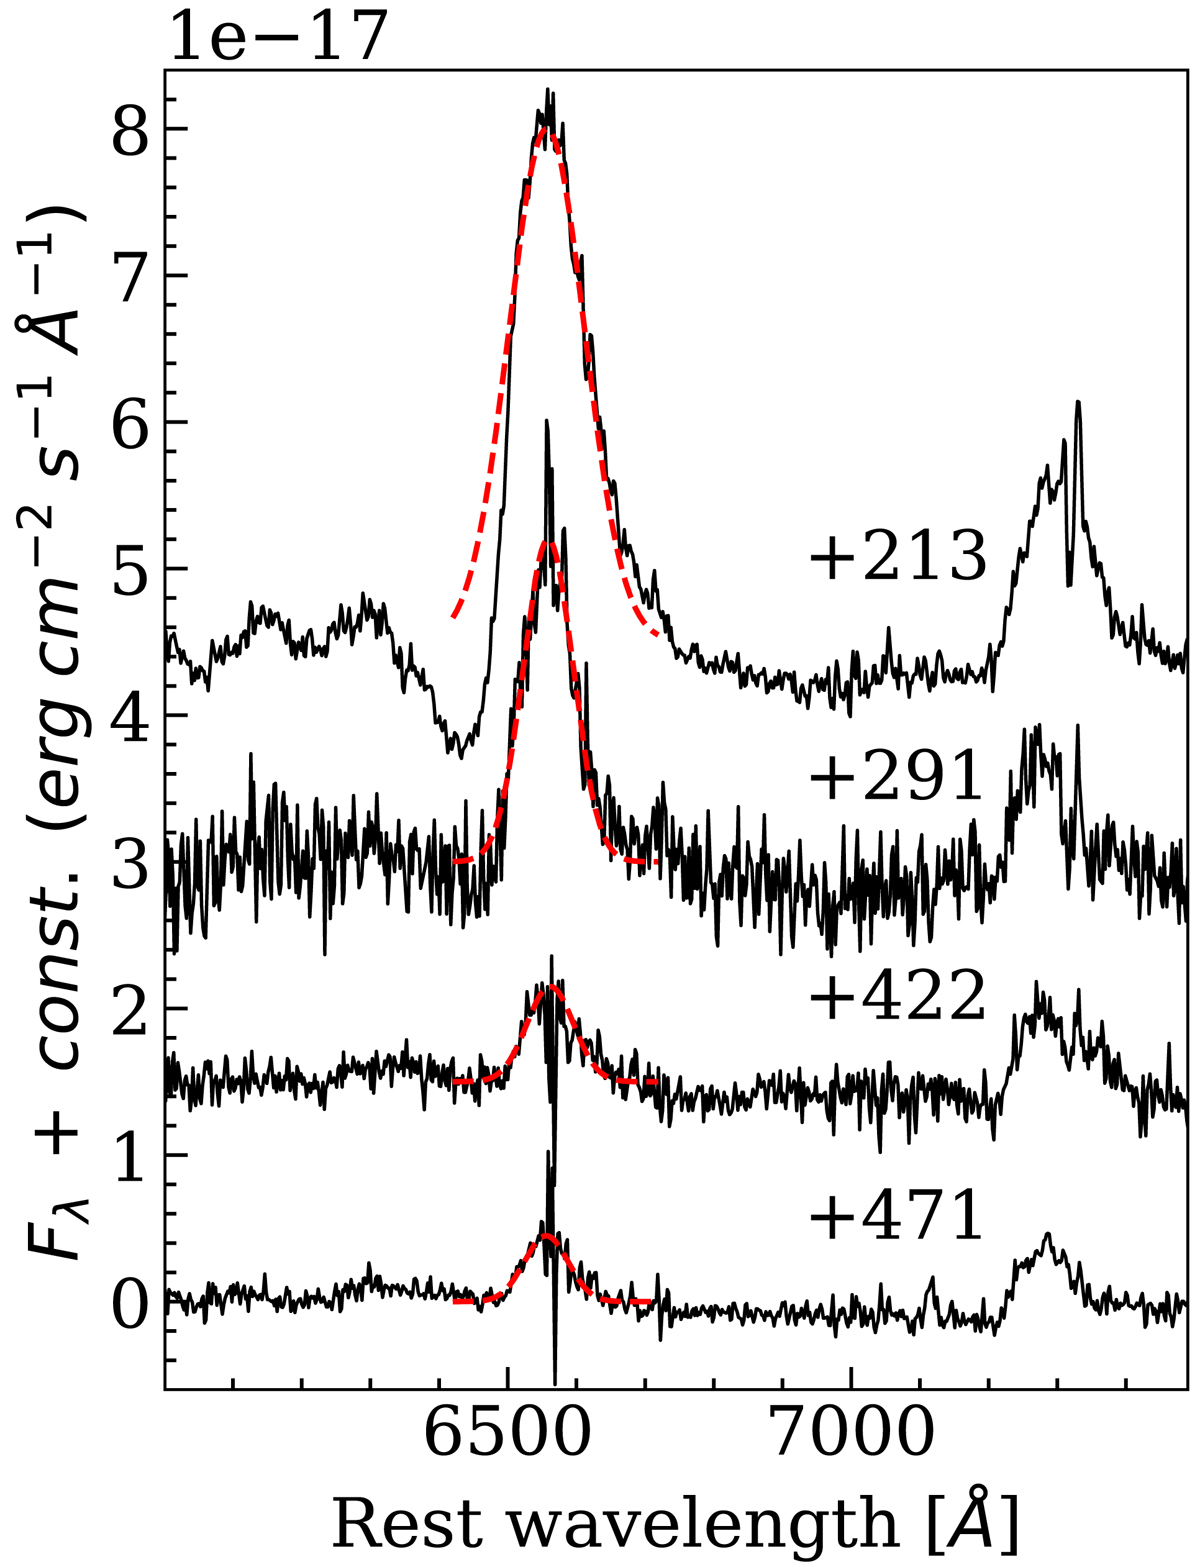
Zoom-in on the Hα region of the last four spectra. The dashed red line shows how, while in the last three spectra the line profile is approximately Gaussian, the earlier one still shows an asymmetric structure due to the P-Cygni absorption. All spectra are reddening- and redshift-corrected and matched in intensity with respect to the Hα emission and arbitrarily shifted for better visualisation.
Current usage metrics show cumulative count of Article Views (full-text article views including HTML views, PDF and ePub downloads, according to the available data) and Abstracts Views on Vision4Press platform.
Data correspond to usage on the plateform after 2015. The current usage metrics is available 48-96 hours after online publication and is updated daily on week days.
Initial download of the metrics may take a while.