Fig. 6.
Download original image
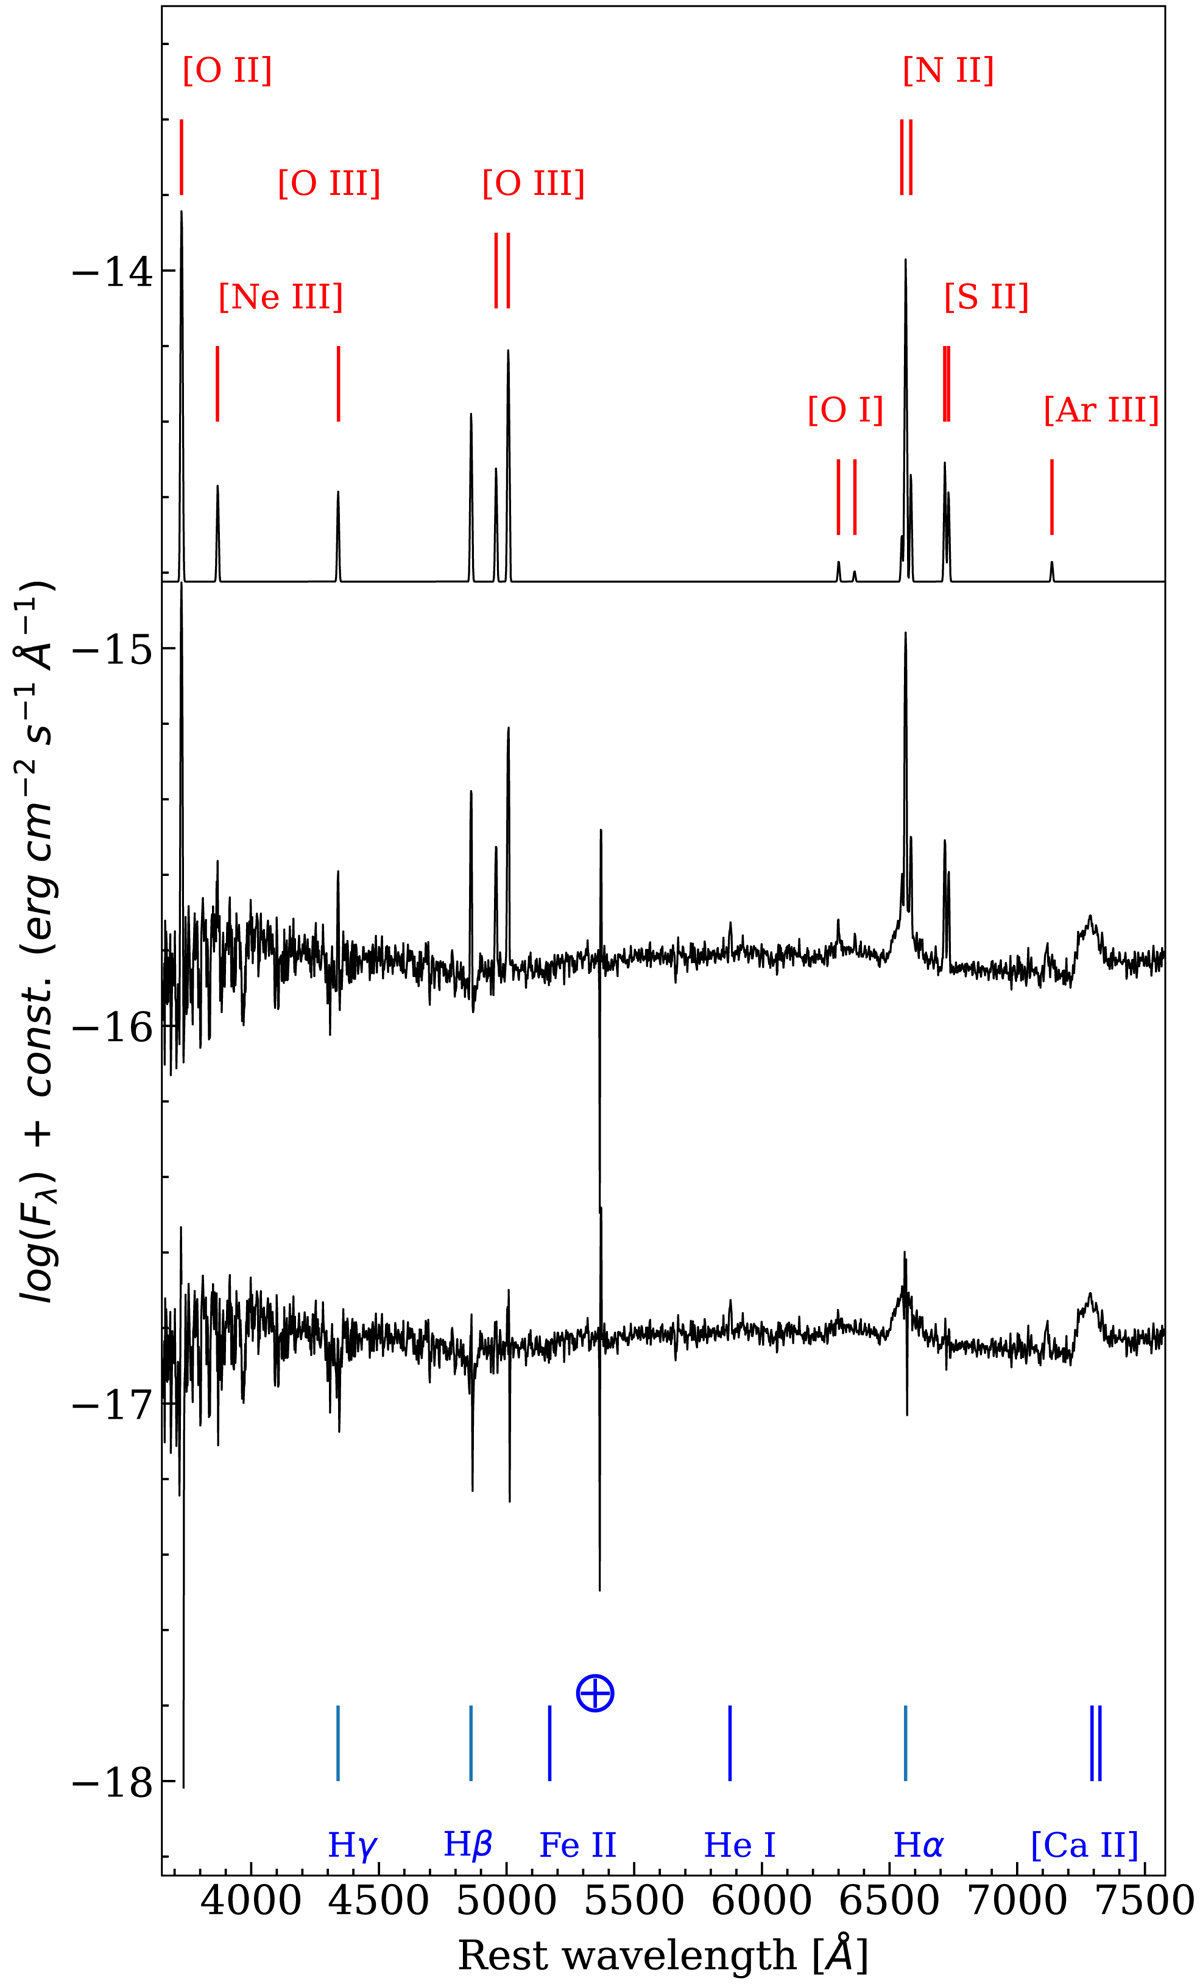
Template subtraction on the spectrum at phase +471 d. The upper spectrum is the template for the line subtraction generated from the middle one (see text), while the lower spectrum is the result of the subtraction. We also indicate the main emission lines. The blue cross indicates a telluric line ([O I]λ5577), which was poorly subtracted and is still present in the final result.
Current usage metrics show cumulative count of Article Views (full-text article views including HTML views, PDF and ePub downloads, according to the available data) and Abstracts Views on Vision4Press platform.
Data correspond to usage on the plateform after 2015. The current usage metrics is available 48-96 hours after online publication and is updated daily on week days.
Initial download of the metrics may take a while.