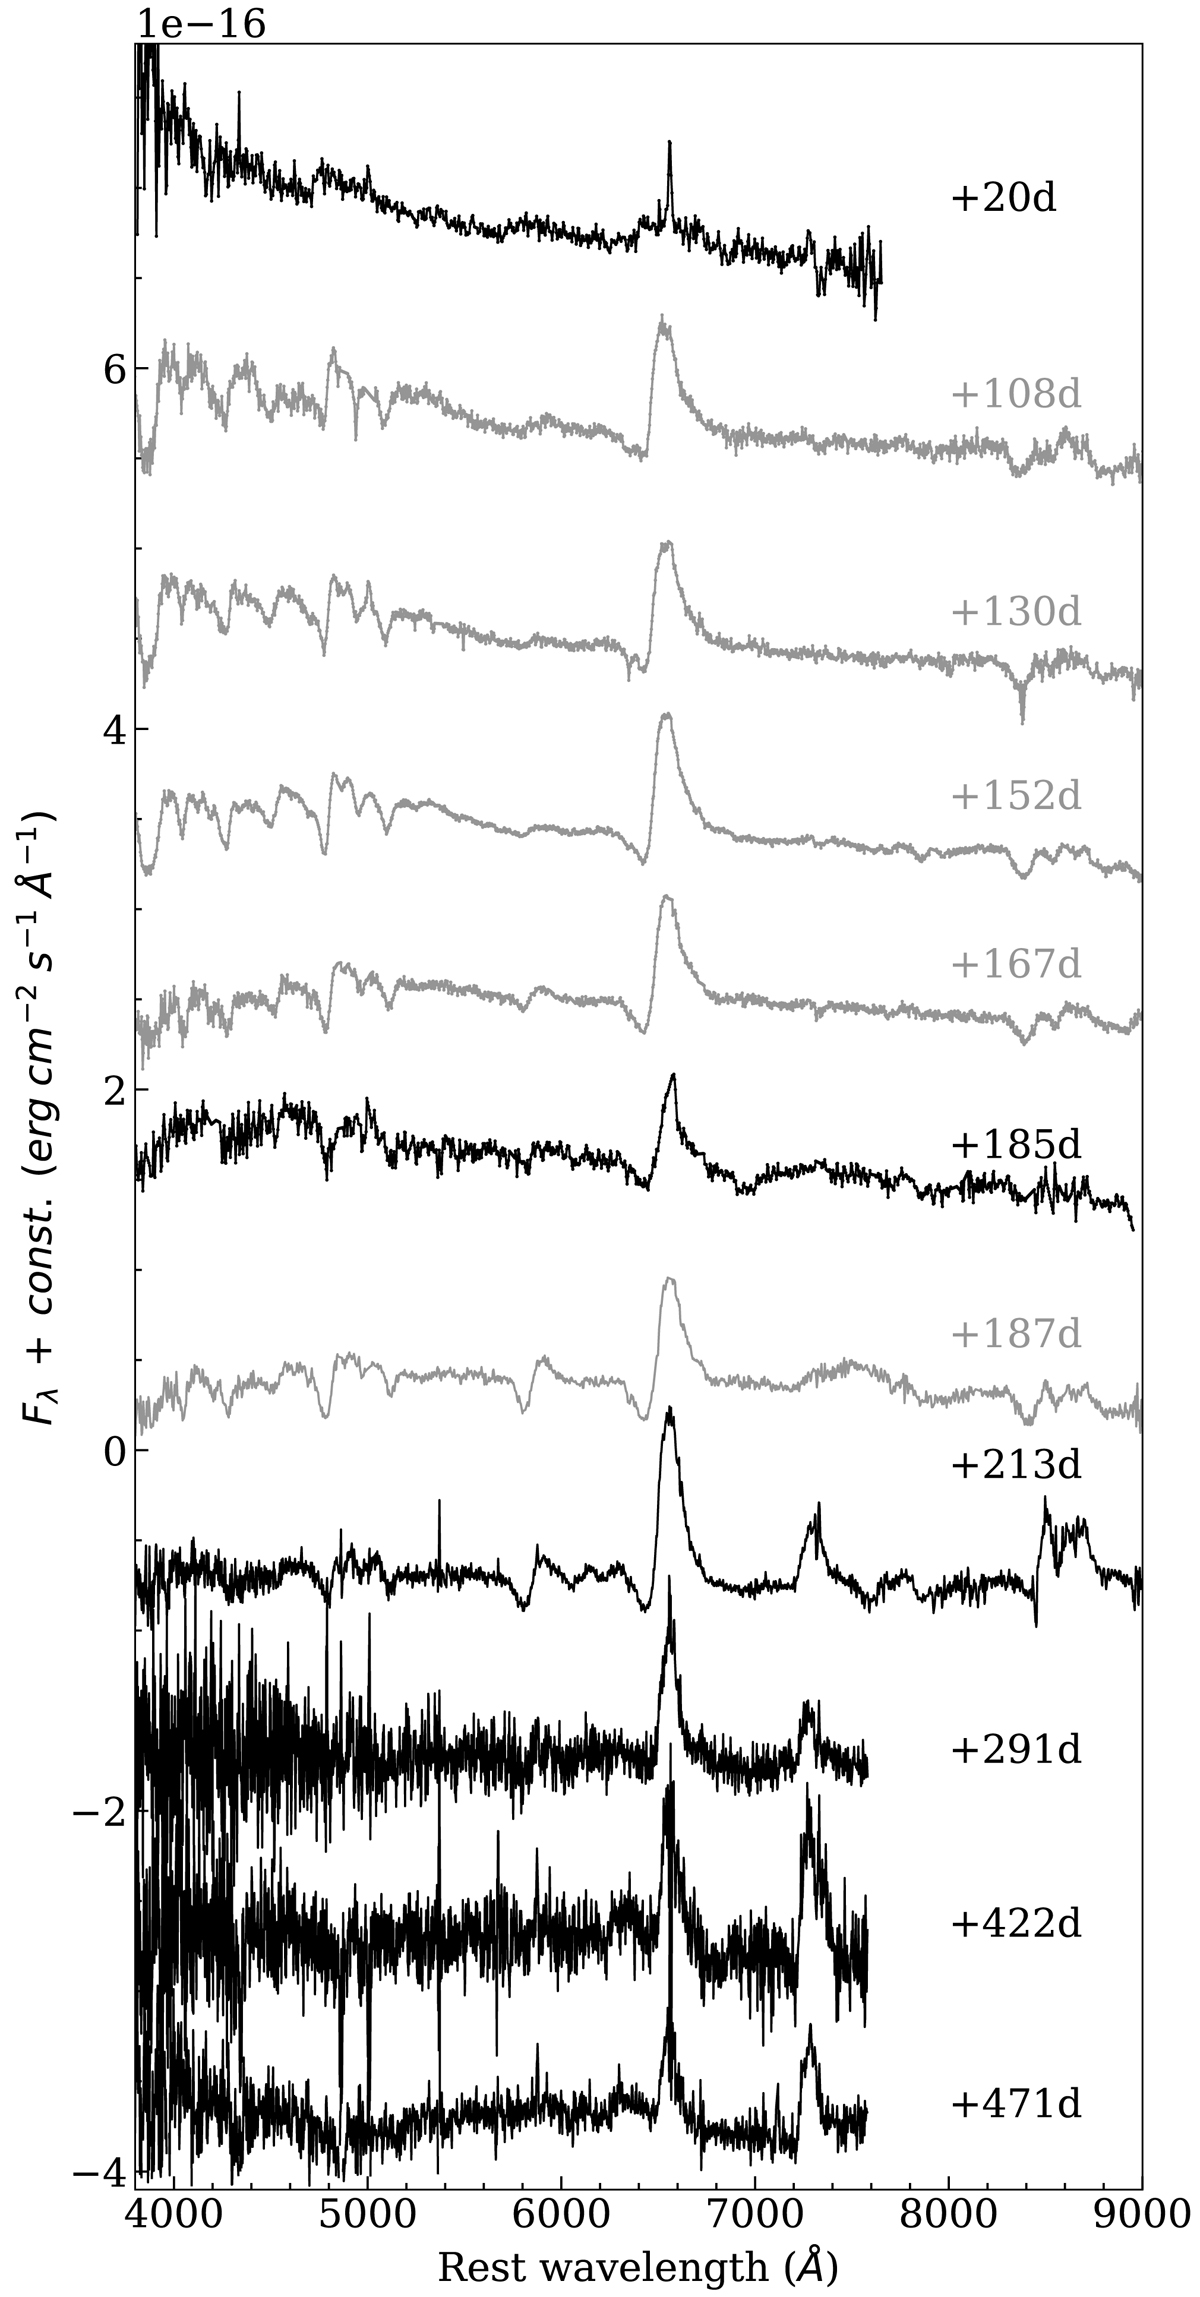
Fig. 5.
Download original image
Spectral evolution of SN 2020faa. Labels indicate the days after the explosion. Spectra in gray are from Y21, while the spectra in black were reduced by us. All spectra are reddening- and redshift-corrected and matched in intensity with respect to the Hα emission and arbitrarily shifted for better visualisation. All spectra are galaxy template-subtracted (see Fig. 6 and text).
Current usage metrics show cumulative count of Article Views (full-text article views including HTML views, PDF and ePub downloads, according to the available data) and Abstracts Views on Vision4Press platform.
Data correspond to usage on the plateform after 2015. The current usage metrics is available 48-96 hours after online publication and is updated daily on week days.
Initial download of the metrics may take a while.