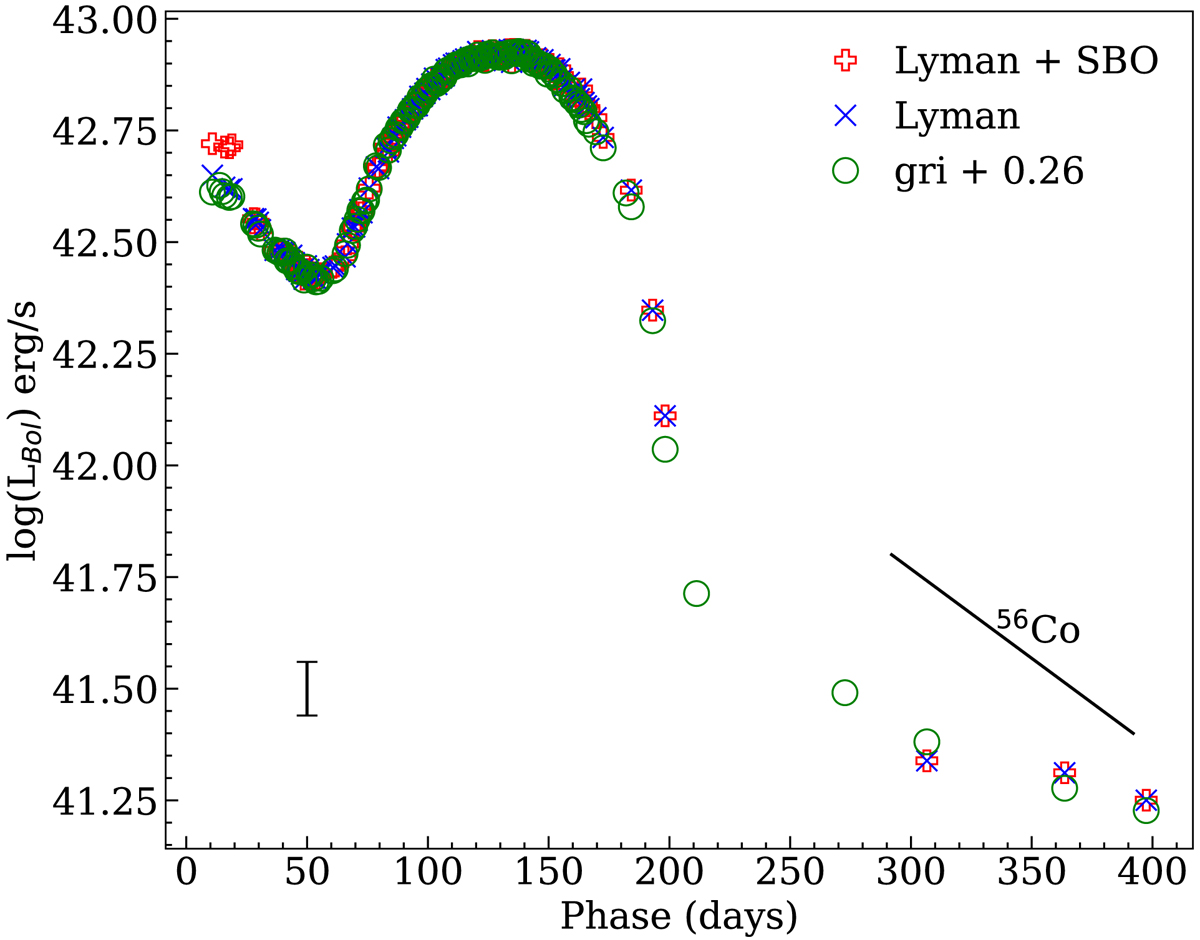
Fig. 4.
Download original image
Comparison of the bolometric light curve derived from the gri integration corrected by a constant (+0.26) accounting for the missing flux fraction (open green circles) and Lyman’s prescription, assuming different limit for the SBO dominated light curve phase, namely: g − r < −0.1 (blue crosses) and g − r < 0.3 (red plus). The black segment on the lower left of the plot represents the errorbar on absolute luminosity calibration due to the uncertainties on distance modulus and extinction.
Current usage metrics show cumulative count of Article Views (full-text article views including HTML views, PDF and ePub downloads, according to the available data) and Abstracts Views on Vision4Press platform.
Data correspond to usage on the plateform after 2015. The current usage metrics is available 48-96 hours after online publication and is updated daily on week days.
Initial download of the metrics may take a while.