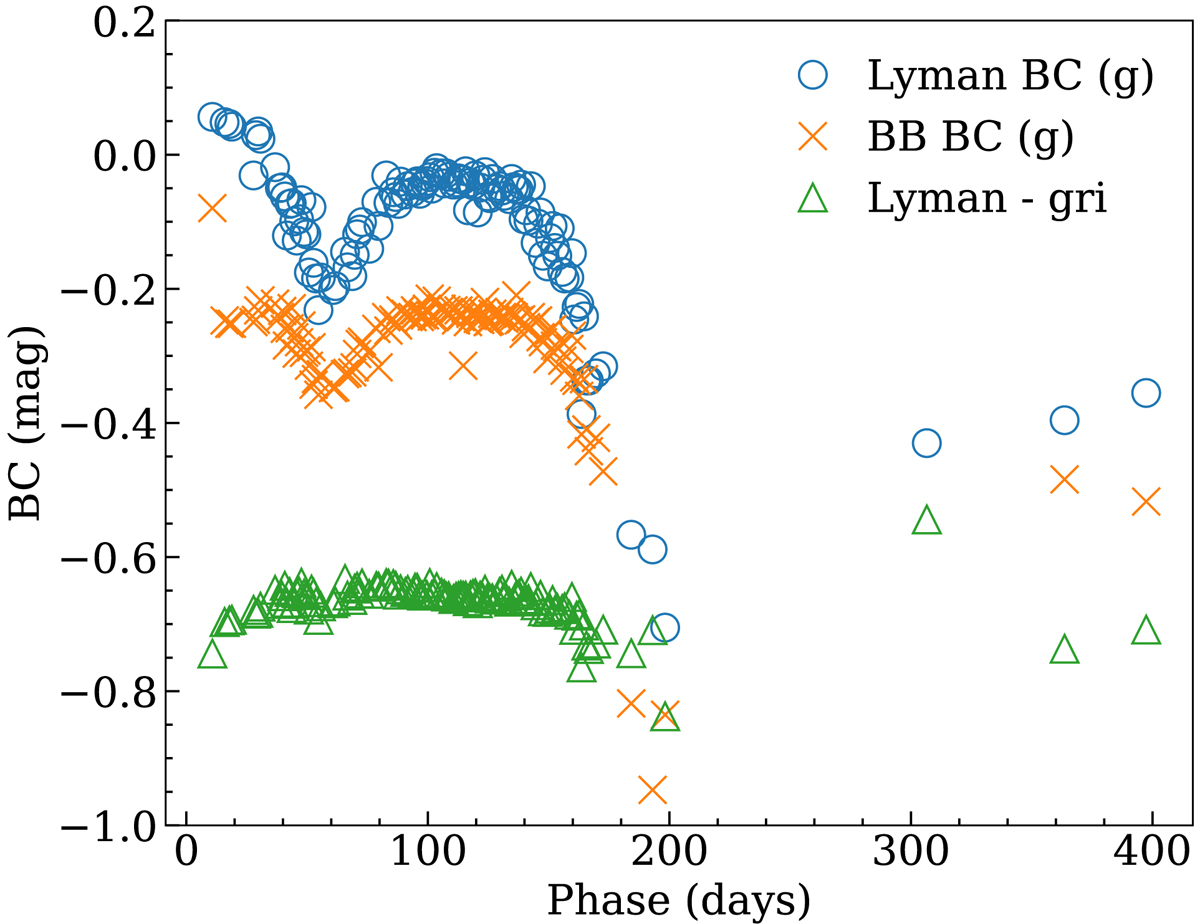
Fig. 3.
Download original image
Comparison of different estimates of the bolometric correction relative to the g band. Blue circles are BC derived from Lyman et al. (2014), while orange crosses are BC after integration of the black body function fitting the available photometry. We also show the difference between Lyman’s correction and the gri integration (green triangles).
Current usage metrics show cumulative count of Article Views (full-text article views including HTML views, PDF and ePub downloads, according to the available data) and Abstracts Views on Vision4Press platform.
Data correspond to usage on the plateform after 2015. The current usage metrics is available 48-96 hours after online publication and is updated daily on week days.
Initial download of the metrics may take a while.