Fig. 14.
Download original image
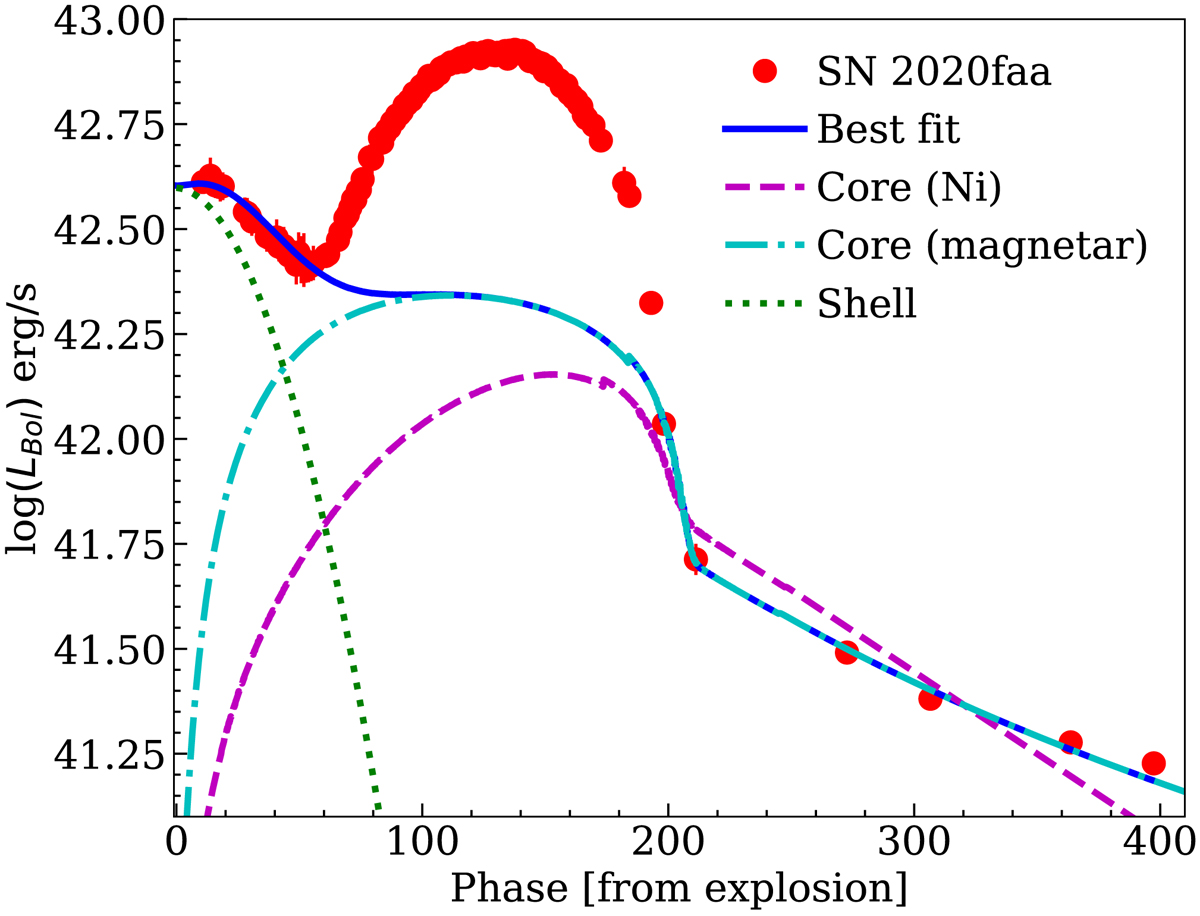
Best fit (solid blue line) of the bolometric luminosity (red dots) with the code LC2 by Nagy et al. (2014) with a shell component (dotted green line) and a core+magnetar component (dash-dotted cyan line). The model does not provide a satisfactory power explanation for the peak, which requires an additional source (see text). An alternative fit with a core+Ni component, which yields a worse fit than the magnetar, is also plotted with a dashed magenta line.
Current usage metrics show cumulative count of Article Views (full-text article views including HTML views, PDF and ePub downloads, according to the available data) and Abstracts Views on Vision4Press platform.
Data correspond to usage on the plateform after 2015. The current usage metrics is available 48-96 hours after online publication and is updated daily on week days.
Initial download of the metrics may take a while.