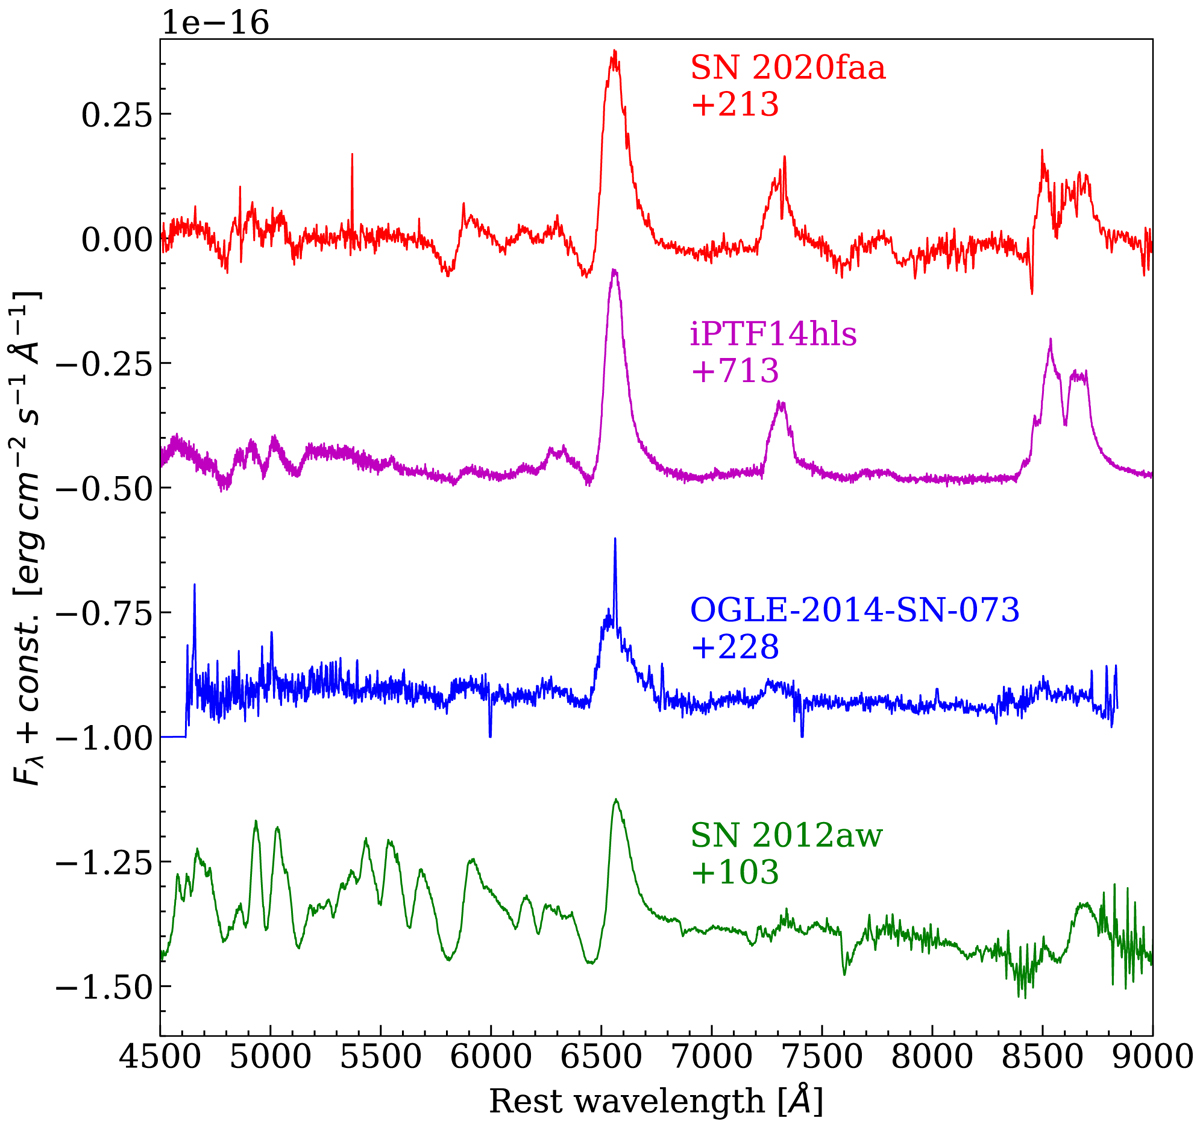
Fig. 13.
Download original image
Spectrum of SN 2020faa at phase 213 d compared with spectra of other SNe in our sample. Spectra are taken at different phases for different SNe but are similar to each other, indicating different evolutionary timescales. Numbers near the spectra are days from explosion. All spectra are matched in intensity with respect to the Hα emission and arbitrarily scaled for better visualisation.
Current usage metrics show cumulative count of Article Views (full-text article views including HTML views, PDF and ePub downloads, according to the available data) and Abstracts Views on Vision4Press platform.
Data correspond to usage on the plateform after 2015. The current usage metrics is available 48-96 hours after online publication and is updated daily on week days.
Initial download of the metrics may take a while.