Fig. 10.
Download original image
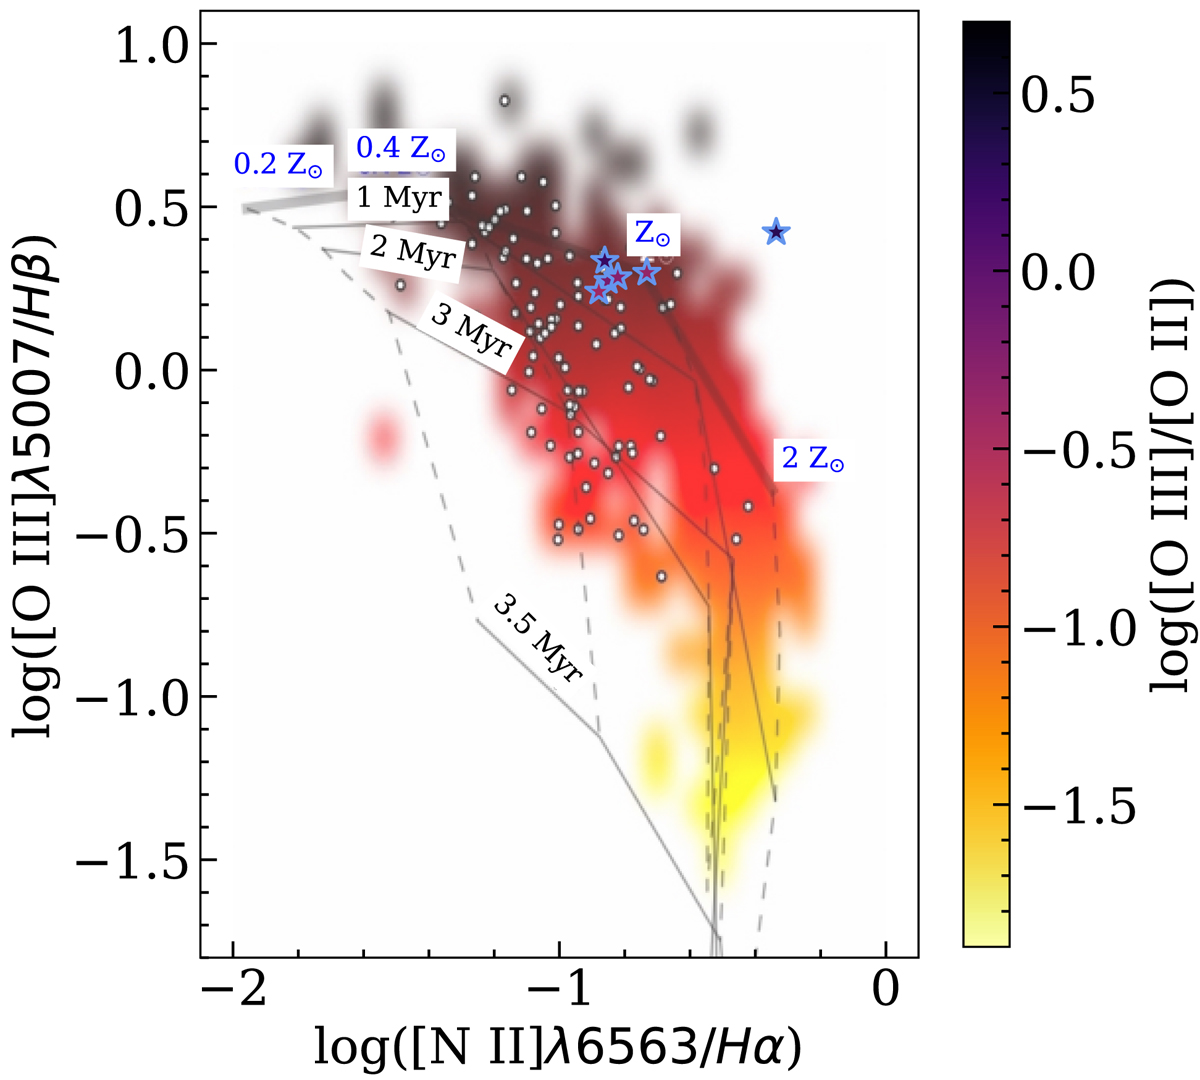
BPT diagram of the underlying H II region. We plot our measurements (purple stars) over Fig. 5 of Bresolin et al. (2012). The positioning of the line ratios in the diagram is, for all spectra, consistent with a fairly young, metal-poor region. Solid lines display the models from Dopita et al. (2006) for ages 0.1 − 3.5 Myr and metallicities 0.2 − 2 Z⊙, while dashed lines indicate constant metallicity.
Current usage metrics show cumulative count of Article Views (full-text article views including HTML views, PDF and ePub downloads, according to the available data) and Abstracts Views on Vision4Press platform.
Data correspond to usage on the plateform after 2015. The current usage metrics is available 48-96 hours after online publication and is updated daily on week days.
Initial download of the metrics may take a while.