Fig. 7
Download original image
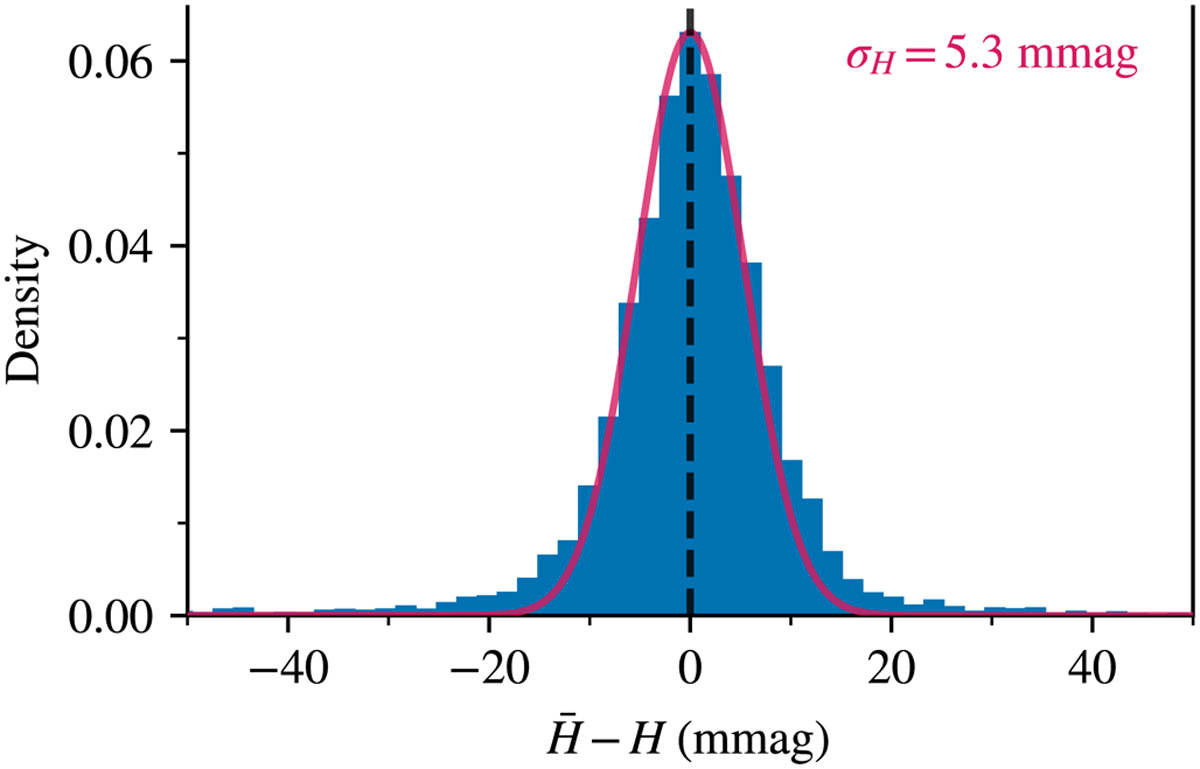
Comparison of measured H-band magnitudes for all epochs of the VISIONS wide survey in Corona Australis. The blue histogram shows the difference of individually measured source magnitudes to their mean magnitude for bright sources (12 < H < 13 mag). The red line depicts a Gaussian centered at zero, with a width determined by the median standard deviation of all included sources.
Current usage metrics show cumulative count of Article Views (full-text article views including HTML views, PDF and ePub downloads, according to the available data) and Abstracts Views on Vision4Press platform.
Data correspond to usage on the plateform after 2015. The current usage metrics is available 48-96 hours after online publication and is updated daily on week days.
Initial download of the metrics may take a while.