Fig. 9
Download original image
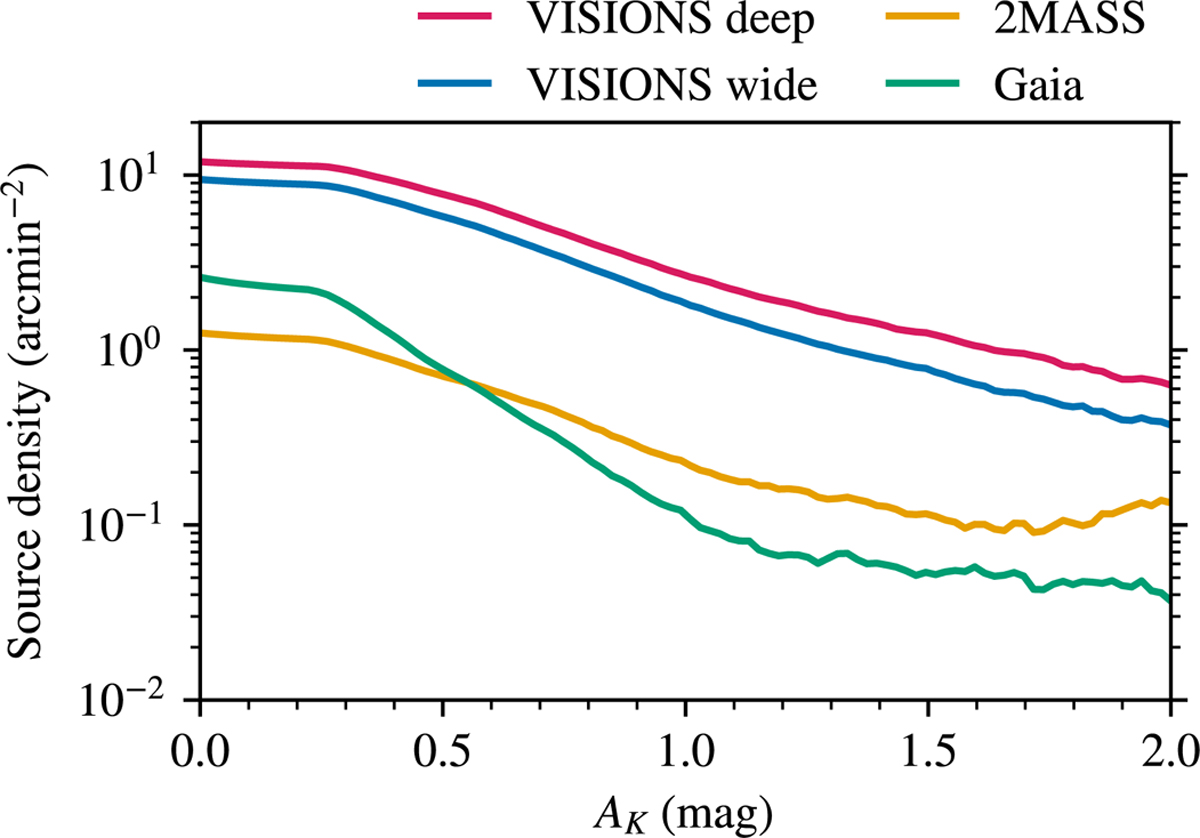
Source density as function of extinction for the VISIONS, Gaia, and 2MASS missions, using data collected on the Orion A star-forming region. The red and blue lines represent VISIONS wide and deep data, while the green and yellow lines mark the Gaia and 2MASS surveys, respectively. Across all levels of extinction, VISIONS outperforms the other surveys by up to an order of magnitude.
Current usage metrics show cumulative count of Article Views (full-text article views including HTML views, PDF and ePub downloads, according to the available data) and Abstracts Views on Vision4Press platform.
Data correspond to usage on the plateform after 2015. The current usage metrics is available 48-96 hours after online publication and is updated daily on week days.
Initial download of the metrics may take a while.