Fig. 7
Download original image
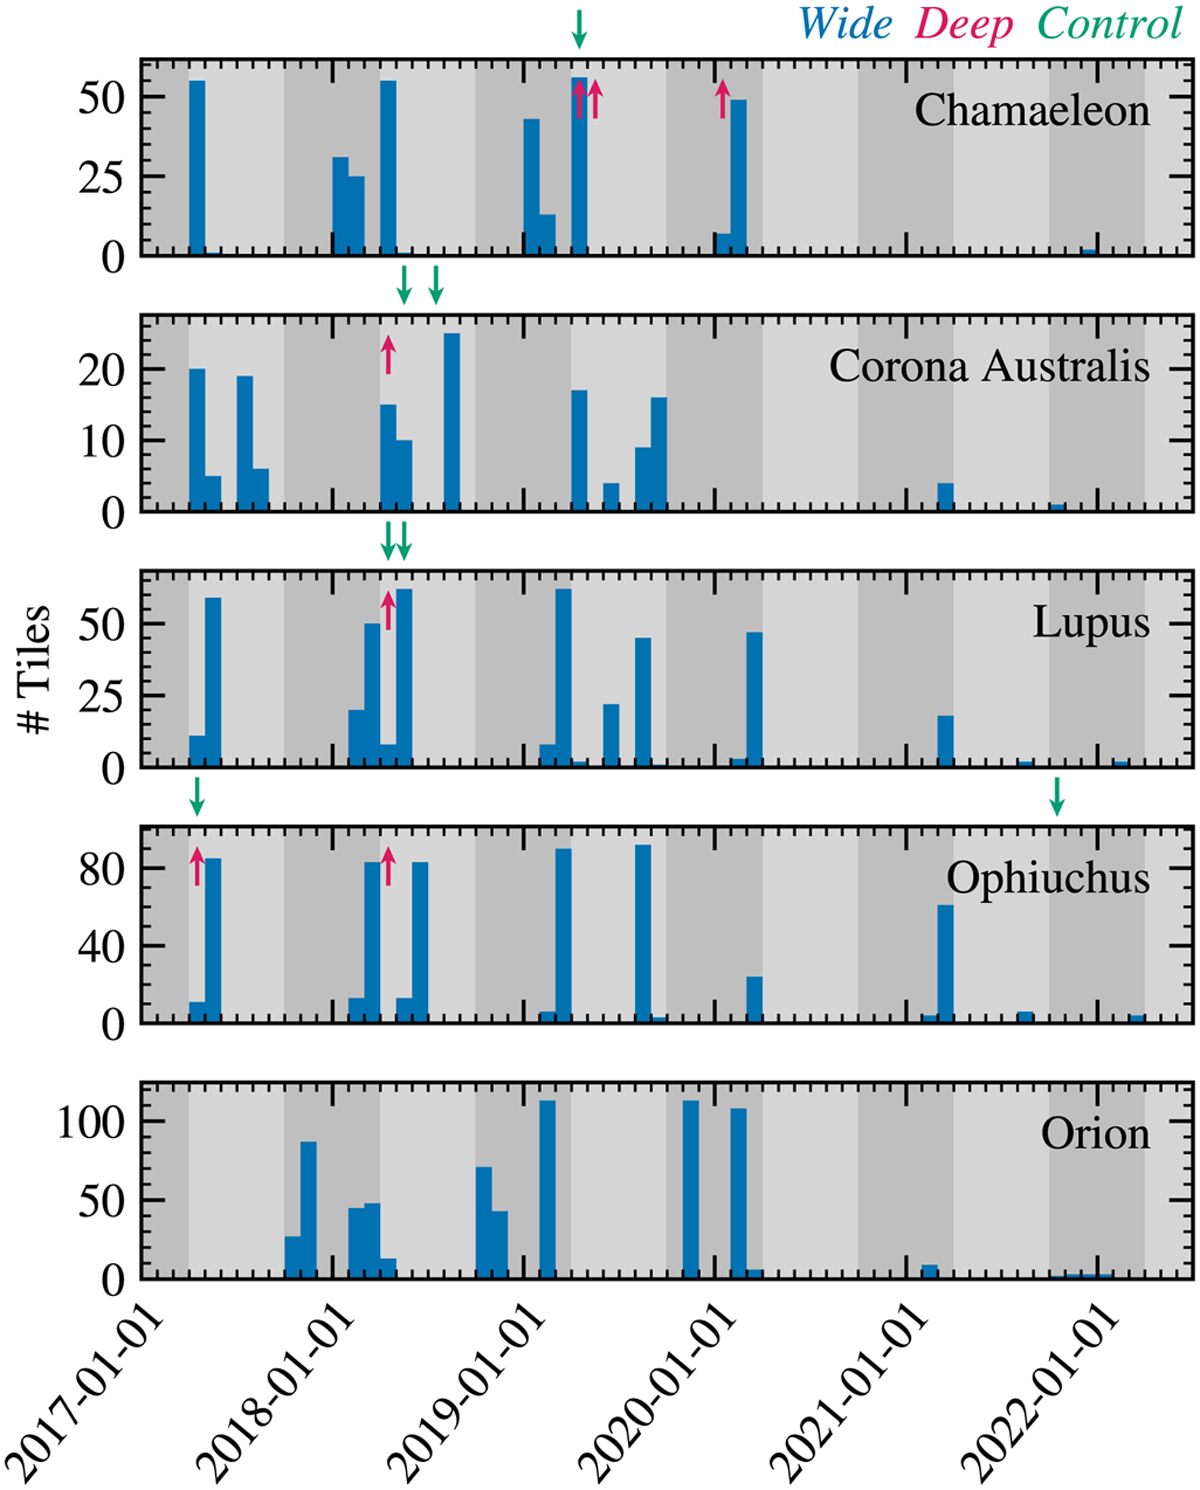
VISIONS observations over the course of the entire survey. The individual panels show the data collection progress for each separate target region. The blue histograms depict the number of imaged tiles in the wide survey. The observing times for the deep and control surveys are marked with red and green arrows at the top axis of each panel. The alternating gray background refers to in dividual ESO periods, with period 99 indicating the start of VISIONS observations on April 1, 2017.
Current usage metrics show cumulative count of Article Views (full-text article views including HTML views, PDF and ePub downloads, according to the available data) and Abstracts Views on Vision4Press platform.
Data correspond to usage on the plateform after 2015. The current usage metrics is available 48-96 hours after online publication and is updated daily on week days.
Initial download of the metrics may take a while.