Fig. 6
Download original image
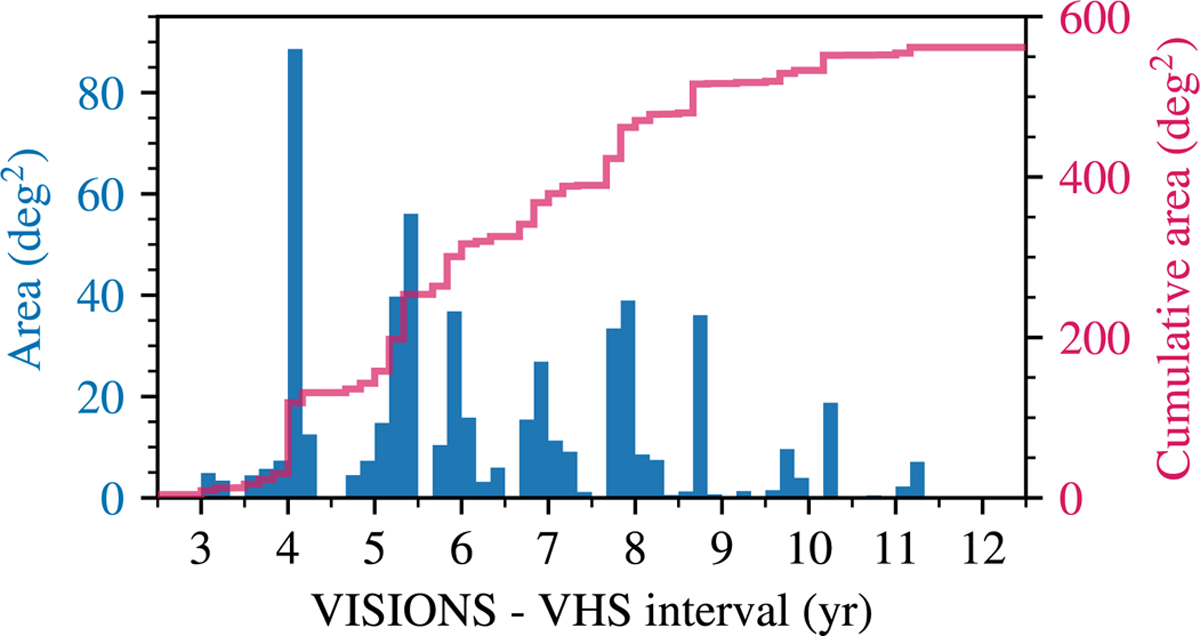
Distribution of the maximum available time interval between VHS and VISIONS observations, constructed from the healpix grid in Fig. 5. The blue histogram shows the captured area as a function of the available time difference between the surveys. The red line displays the same statistic in cumulative form. As a consequence of the broad, multimodal range of available time baselines, the accuracy of derived proper motions will vary accordingly.
Current usage metrics show cumulative count of Article Views (full-text article views including HTML views, PDF and ePub downloads, according to the available data) and Abstracts Views on Vision4Press platform.
Data correspond to usage on the plateform after 2015. The current usage metrics is available 48-96 hours after online publication and is updated daily on week days.
Initial download of the metrics may take a while.