Fig. 5
Download original image
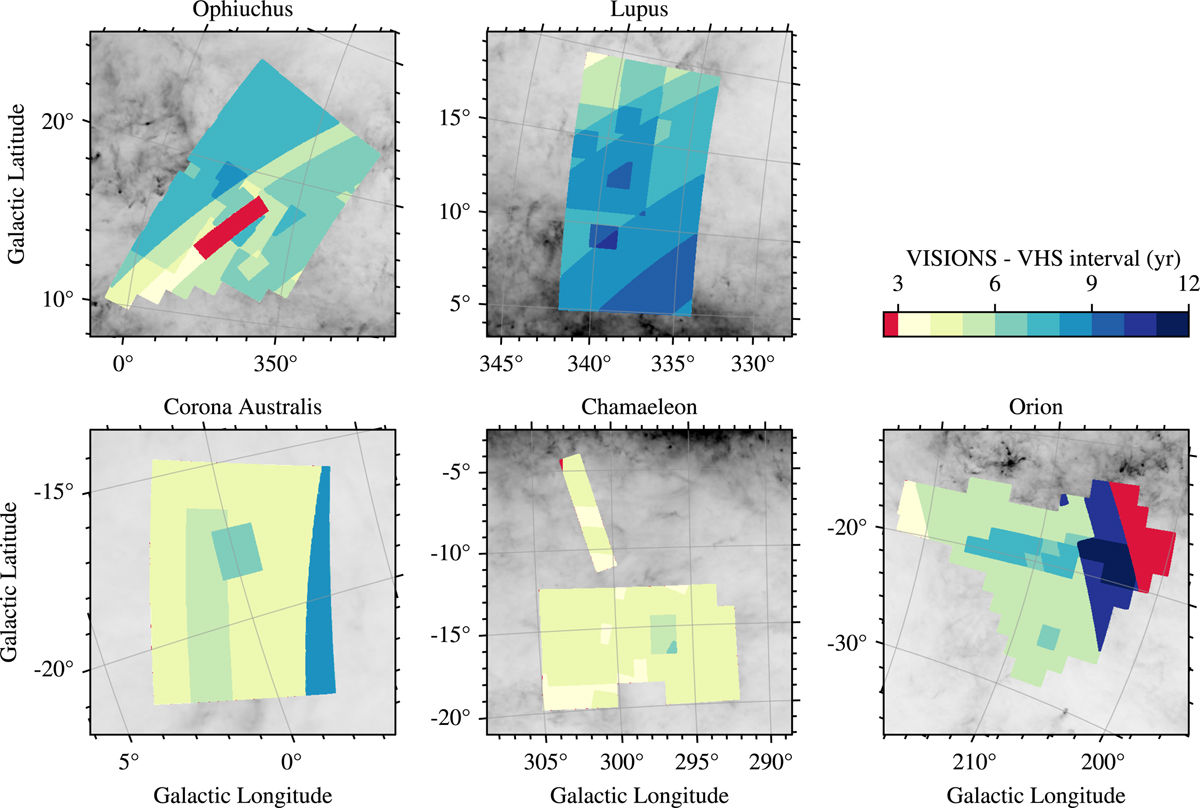
Maximum available time baseline between VISIONS and VHS observations. Each panel shows a close-up view of the star-forming complexes, as imaged in the wide subsurvey, on top of a Planck 857 GHz map. The colorscale shows the time difference between the first VHS observations and the last VISIONS wide field, mapped onto a healpix grid with a pixel size of 47 arcmin2. Time intervals of less than 3 yr are indicated in red. A distinct pattern becomes visible, depicting the complex observation strategy of both surveys.
Current usage metrics show cumulative count of Article Views (full-text article views including HTML views, PDF and ePub downloads, according to the available data) and Abstracts Views on Vision4Press platform.
Data correspond to usage on the plateform after 2015. The current usage metrics is available 48-96 hours after online publication and is updated daily on week days.
Initial download of the metrics may take a while.