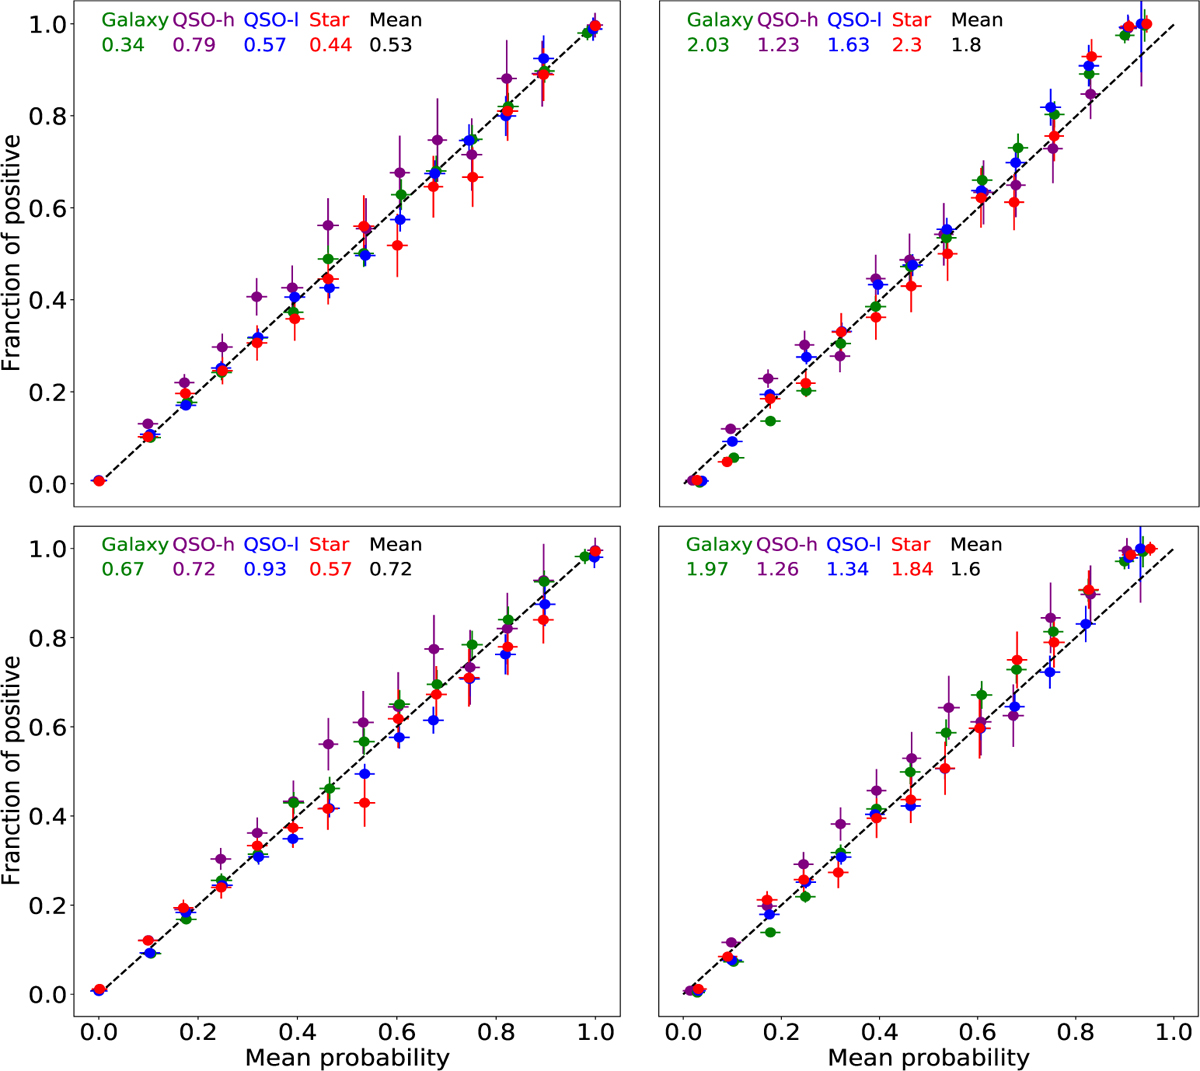
Fig. 6
Download original image
Fraction of positives for each one of the classes as a function of the mean predicted probability. The ECE for galaxies, QSO-h, QSO-l, stars, and the mean ECE are shown at the top left side of each panel. The error bar represents the standard deviation in each one of the bins. The left panels are trained with the original training set, and the right panel used the hybrid set. The top (bottom) panels show the results of ANN1 (ANN2).
Current usage metrics show cumulative count of Article Views (full-text article views including HTML views, PDF and ePub downloads, according to the available data) and Abstracts Views on Vision4Press platform.
Data correspond to usage on the plateform after 2015. The current usage metrics is available 48-96 hours after online publication and is updated daily on week days.
Initial download of the metrics may take a while.