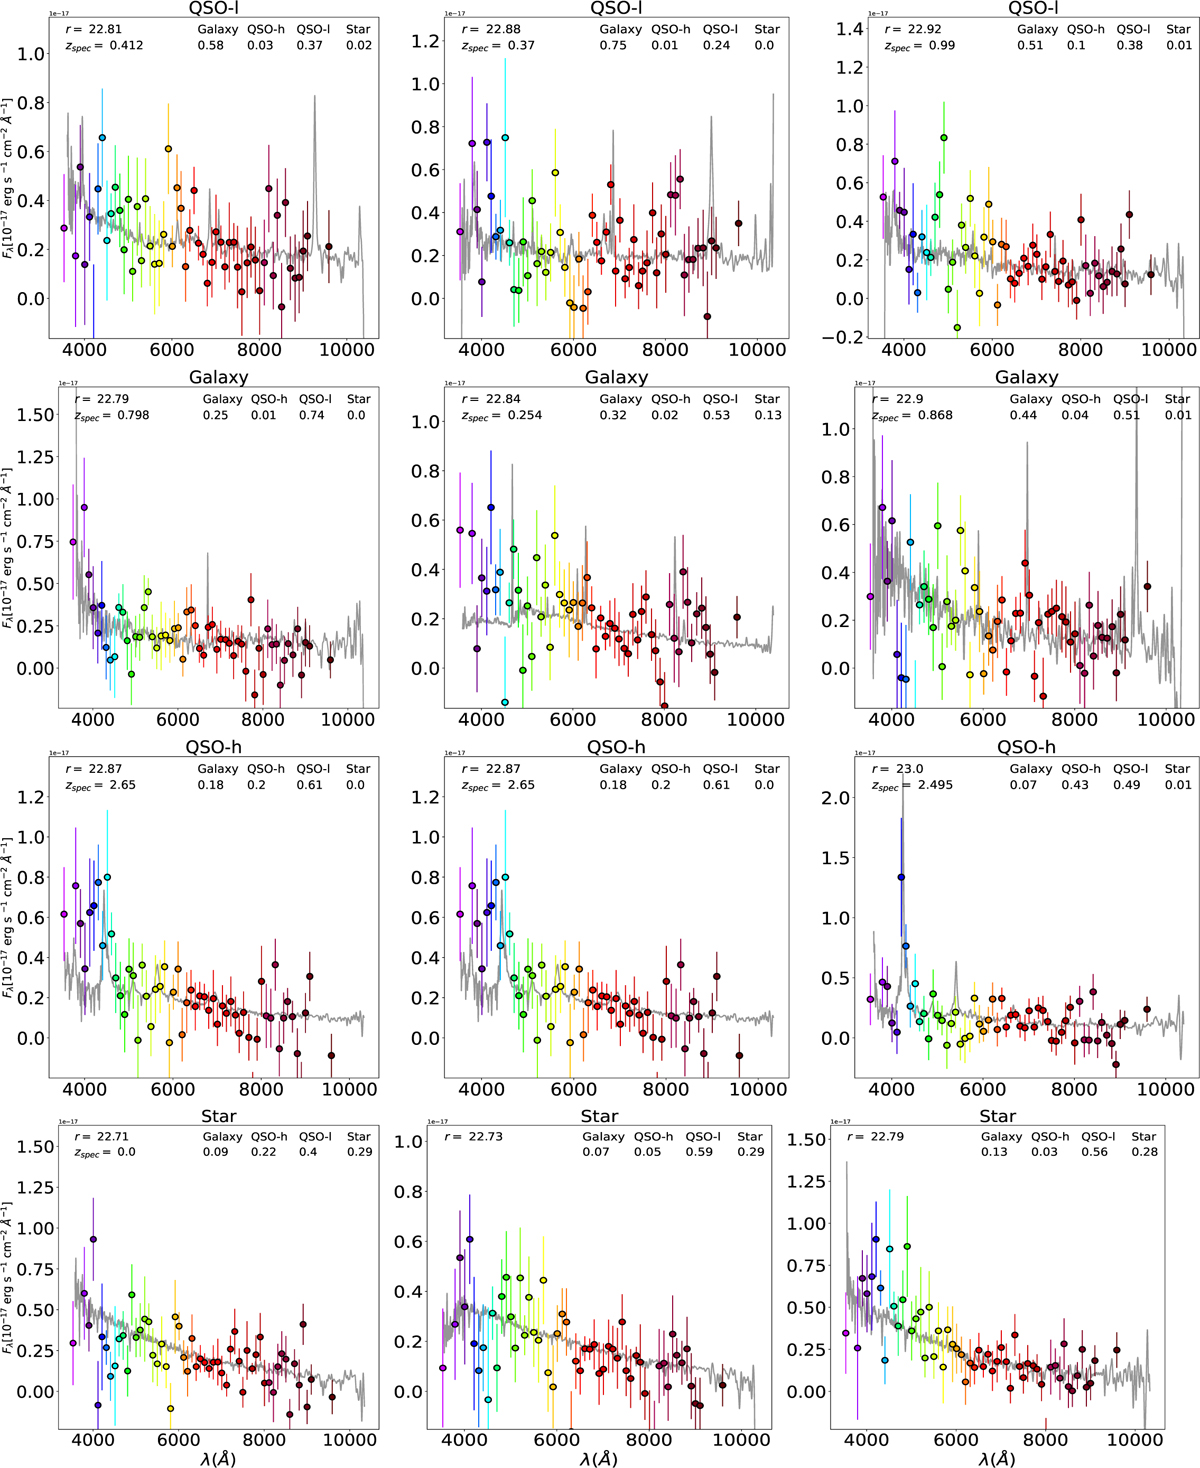
Fig. 4
Download original image
Examples of the most typical misclassification of objects in the mock test sample. The first row shows QSO-l classified as galaxies, the second row shows galaxies classified as QSO-l, the third row shows QSO-h classified as QSO-l, and the fourth row shows stars classified as QSO-l. From left to right, the objects are fainter. In each panel, we indicate the AB magnitude in the r band, the redshift (top left), and the probabilities yielded by the ANN1 classifier for each one of the classes (top right). The SDSS spectra from which the test sample is generated are shown in the background in grey.
Current usage metrics show cumulative count of Article Views (full-text article views including HTML views, PDF and ePub downloads, according to the available data) and Abstracts Views on Vision4Press platform.
Data correspond to usage on the plateform after 2015. The current usage metrics is available 48-96 hours after online publication and is updated daily on week days.
Initial download of the metrics may take a while.