Fig. 13
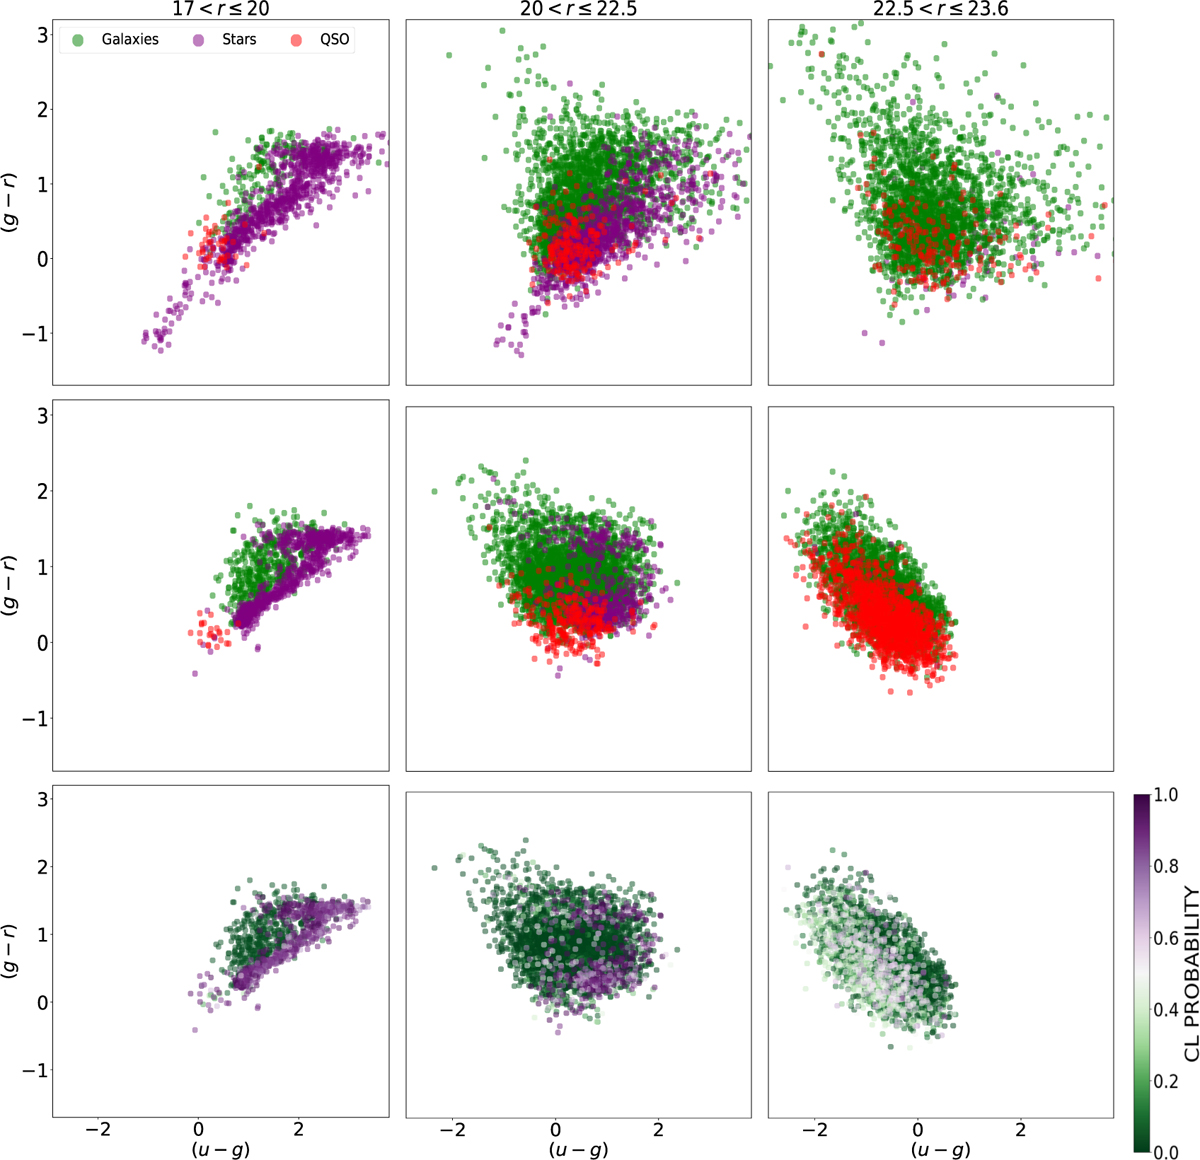
Download original image
Observed (g – r) vs. (u – g) colour-colour diagram for the 1 deg2 mock sample (first row) and miniJPAS observations (second and third rows). Stars, galaxies, and QSOs are predicted classes with the ANN1 in miniJPAS observations, while they are true classes in the 1deg2 mock sample. The dots in the third row are colour-coded according to the SExtractor probability developed to separate between point-like sources (CL > 0.5) and extended sources (CL < 0.5). Each column includes objects at different magnitude bins.
Current usage metrics show cumulative count of Article Views (full-text article views including HTML views, PDF and ePub downloads, according to the available data) and Abstracts Views on Vision4Press platform.
Data correspond to usage on the plateform after 2015. The current usage metrics is available 48-96 hours after online publication and is updated daily on week days.
Initial download of the metrics may take a while.